Drawdown is one of the most vital risk metrics in trading and investing, yet many beginners overlook it while chasing profits. Understanding drawdown helps traders measure the extent to which their account balance declines from a peak to a trough during a trading period. It's a key indicator of the risk involved in a strategy or portfolio.
Whether you're trading forex, stocks, or commodities, monitoring drawdown can mean the difference between sustainable growth and blowing up your account.
In this article, we'll explore the meaning of drawdown, its types, how it's calculated, real-world examples, and how to manage it like a professional.
What Is Drawdown in Trading?
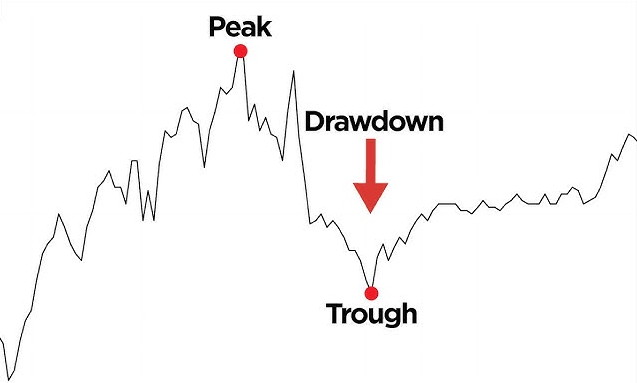
In simple terms, drawdown is the reduction of your trading capital from its highest point. It's usually expressed as a percentage and highlights the maximum loss during a specific time frame. Drawdowns are a frequent aspect of trading—however, comprehending them is essential for assessing the risk associated with any trading strategy.
For example, if your Trading Account grew to $10,000 and then dropped to $8,000, your drawdown is $2,000 or 20%.
Drawdowns do not measure total losses. They represent temporary declines and can recover if the trading performance improves.
Drawdown vs Volatility
While both drawdown and volatility relate to risk, they are not the same:
A strategy may experience significant volatility but minor drawdowns—or low volatility with infrequent, severe drawdowns. Managing both is crucial for consistent trading performance.
Importance of Drawdown in Trading
As mentioned above, drawdown is essential because it reflects risk exposure, emotional pressure, and the resilience of your strategy. Here's why drawdown matters:
It helps assess the risk-adjusted performance
It indicates the maximum pain your account might endure
It affects trading psychology and decision-making
It helps determine how long recovery might take
Most professional traders set strict drawdown limits—often 10-20%—to stay within a comfortable risk zone.
Types of Drawdowns in Trading
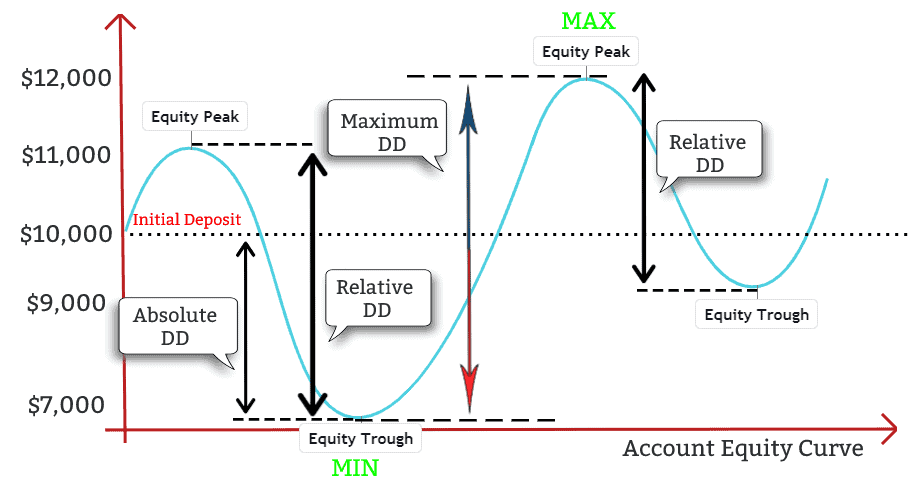
1. Absolute Drawdown
It measures the drop from your initial deposit to the lowest point your equity has reached. It tells you how much you've lost from the starting capital.
Example:
2. Maximum Drawdown
It is the largest drop from a peak to the subsequent lowest point in the account balance. It's the most common type used by traders and investors.
Example:
Peak equity: $10,000
Lowest equity after peak: $7,000
Maximum drawdown: $3,000 or 30%
3. Relative Drawdown
It expresses the maximum drawdown as a percentage of your peak capital. It's effective for comparing strategies across different account sizes.
Formula:
Each type tells a slightly different story. Together, they provide a more complete picture of your trading risk.
How to Calculate: Step-by-Step Guide
Step 1: Record Your Equity Peaks
Monitor the highest point your account balance reaches during a trading period.
Step 2: Identify the Subsequent Low
Track the lowest value before the account recovers to or surpasses the previous peak.
Step 3: Apply the Formula
Drawdown (%) = (Peak Value - Trough Value) / Peak Value × 100
Example:
Use this formula for every drop and identify the worst case for your maximum drawdown.
Real-Life Examples
Forex Example
A trader grows their account from $10,000 to $12,000 but hits a losing streak, and the balance falls to $8,500.
Even if they recover to $13,000 later, that 29.17% drawdown indicates high volatility in their trading.
Stock Portfolio Example
An investor's portfolio reaches a high of $100,000 before a market crash drops it to $70,000.
Recovery would need a 42.8% increase to reach the break-even point—emphasising the risks associated with significant drawdowns.
What Is an Acceptable Drawdown?
There's no universal number, but here's a rough guideline:
0–10%: Low-risk, conservative strategies
10–20%: Moderate-risk, suitable for most swing or day traders
20–30%: Aggressive strategies, acceptable for high-reward systems
30%+: High-risk territory, often unsustainable long-term
Ultimately, the larger the drawdown, the more effort it takes to recover. That’s because you need a greater percentage return to regain your original balance.
| Drawdown (%) |
Required Gain to Recover (%) |
| 10% |
11.1% |
| 20% |
25% |
| 30% |
42.9% |
| 50% |
100% |
| 70% |
233% |
This highlights why preserving capital is more important than chasing high returns.
Trading Strategies to Minimise Drawdown
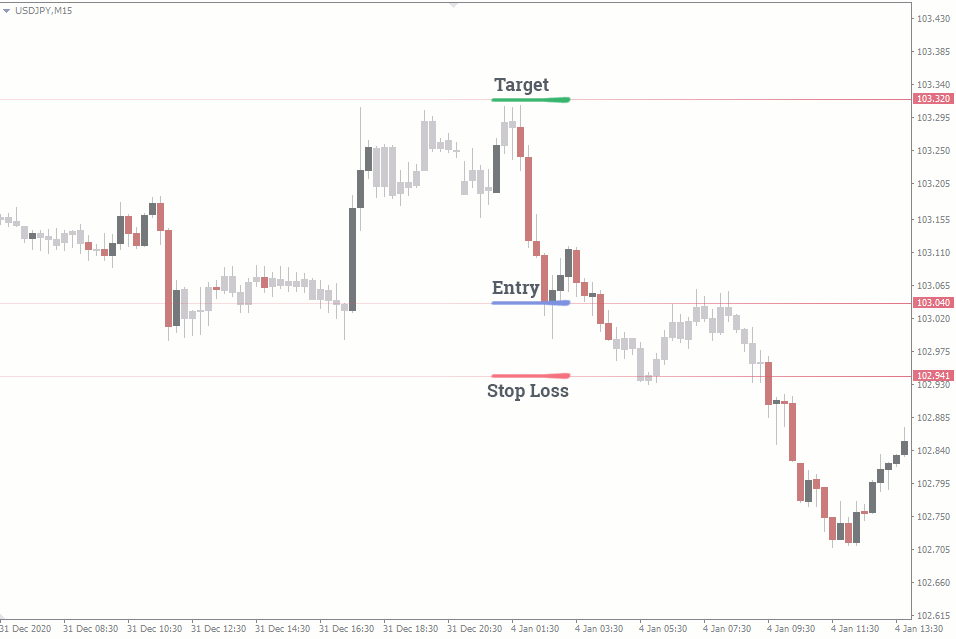
1. Position Sizing
Only risk 1–2% of your account per trade. This way, even a string of losses won't cause massive equity dips.
2. Stop-Loss Orders
Never trade without a stop-loss. It prevents losses from growing uncontrollably.
3. Diversification
Don't put all your capital into one asset or market. A diversified approach reduces single-point failure.
4. Use of Risk-Reward Ratios
Aim for trades with at least 1:2 or 1:3 reward-to-risk. Even with a 40% win rate, you can be profitable if your winners are larger than your losers.
5. Avoid Overleveraging
High leverage increases drawdown risk. Use leverage responsibly, especially in volatile markets.
Conclusion
In conclusion, drawdown is an unavoidable part of trading, but understanding and managing it is what separates winners from losers. Whether you're building a manual Trading plan or testing a new algorithm, drawdown tells you how much risk you're really taking.
If you focus on protecting capital and managing drawdown, profits will take care of themselves. Trading isn't just about maximising gains—it's about minimising the damage when things go wrong.
Disclaimer: This material is for general information purposes only and is not intended as (and should not be considered to be) financial, investment or other advice on which reliance should be placed. No opinion given in the material constitutes a recommendation by EBC or the author that any particular investment, security, transaction or investment strategy is suitable for any specific person.


