Published on: 2025-07-15

In the realm of technical analysis, few tools are as time-tested and widely used as pivot points. Originally developed by floor traders in the early days of futures markets, pivot points have since evolved into one of the most popular intraday trading strategies for forex, commodities, indices, and stocks.
The central idea behind pivot trading is to identify key price levels that act as support and resistance zones, helping traders anticipate potential turning points in the market. This article explores the classic daily pivot point strategy, from how to calculate the levels to practical trade applications for modern markets.

At the heart of pivot trading is a simple mathematical formula that uses the previous day's high, low, and close to generate a set of predictive price levels for the current day.
The standard pivot point (PP) is calculated as:
PP = (High + Low + Close) / 3
Once the central pivot point is established, support and resistance levels are derived:
R1 = (2 × PP) − Low
S1 = (2 × PP) − High
R2 = PP + (High − Low)
S2 = PP − (High − Low)
Some traders also calculate R3 and S3 for extended moves.
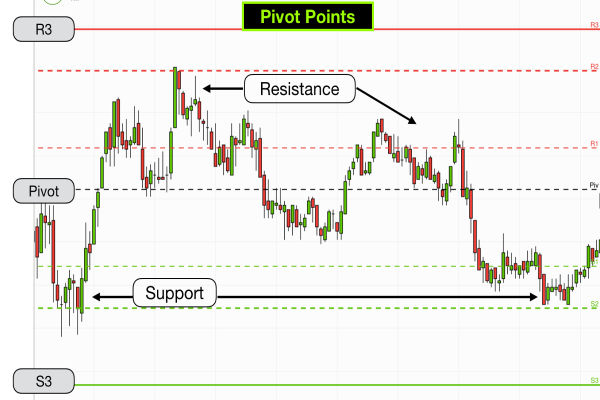
These levels act as a reference framework throughout the day. For example, if the price is above the pivot, it signals bullish momentum, while trading below it often indicates bearish conditions. Many trading platforms, including TradingView, MetaTrader, and Thinkorswim, allow automatic plotting of these levels.

A fundamental rule in pivot trading is to treat the central pivot point as a trend filter. This means:
If price is above the pivot point, the day's bias is bullish.
If price is below the pivot point, the bias is bearish.
This simple distinction helps traders decide:
Which direction to favour for new trades.
Whether to use support or resistance levels as entry zones.
For example, if WTI crude oil opens above its daily pivot and stays above it, traders might look to buy on dips near the pivot or S1. targeting R1 and R2 as profit levels.
This principle also reduces noise by discouraging counter-trend trades unless supported by strong reversal signals.
One popular application is the bounce strategy, where traders anticipate a price rejection at or near pivot-related levels.
Example setup:
If price opens near the pivot, drops to S1. and shows bullish candles (e.g., hammer, bullish engulfing), a trader may enter a long trade at or near S1.
Stop-loss: below S2
Take-profit: PP or R1
The same logic applies for short trades when price rallies to R1 or R2 but fails to break through, forming bearish reversal patterns.
This strategy works well in range-bound markets and is often used by day traders on 15-minute or 1-hour charts. Traders may also add indicators like RSI or MACD to confirm reversal strength.
Unlike the bounce approach, the breakout strategy focuses on moments when price decisively breaches a pivot level, often with volume confirmation or strong candles.
Breakout long setup:
Price breaks above R1 with a bullish candle and increased volume.
Entry: after the close above R1
Stop-loss: just below R1
Take-profit: R2 or R3
Breakout short setup:
Price breaks below S1
Stop-loss above S1
Target: S2 or S3
These trades align with momentum and continuation, particularly during the London or New York open, when institutional volume often drives significant price movements.
Breakout setups are most effective in strong-trending markets, or when backed by economic news, oil inventory releases, or major equity catalysts.
Pivot trading becomes even more powerful when combined with price action tools such as:
Candlestick reversal patterns (e.g., doji, hammer, shooting star)
Engulfing patterns at pivot zones
Volume surges near R1 or S1 (suggesting institutional interest)
For example:
If price reaches S1 and forms a hammer with increasing volume, this strengthens the case for a reversal back toward the pivot.
A bearish engulfing candle at R2 could indicate resistance and a potential short trade.
By waiting for confirmation at pivot zones rather than blindly entering, traders improve their win rate and timing, especially in volatile assets like crude oil, NASDAQ futures, or GBP/USD.
The classic pivot point strategy offers traders a simple yet highly effective method for analysing intraday price action. By focusing on objective levels derived from historical price data, pivot trading reduces emotional bias and provides a consistent framework for both trend-following and reversal setups.
Whether you're a novice looking for structure or an experienced trader seeking high-probability intraday entries, understanding how to trade around pivots can dramatically sharpen your edge in the market.
For best results, use pivot levels in combination with:
Strong risk management
Volatility filters (like ATR or session timing)
Confirmation from price action or momentum indicators
With discipline and chart time, pivot trading can become a reliable backbone of any technical strategy.
Disclaimer: This material is for general information purposes only and is not intended as (and should not be considered to be) financial, investment or other advice on which reliance should be placed. No opinion given in the material constitutes a recommendation by EBC or the author that any particular investment, security, transaction or investment strategy is suitable for any specific person.