Published on: 2025-06-23

Japanese candlestick patterns have stood the test of time as one of the most reliable and visually intuitive tools for reading market sentiment.
First introduced by Japanese rice traders in the 18th century, these patterns have become a staple in technical analysis across global financial markets, like forex, stocks and commodities.
In this guide, we'll walk you through 10 of the most crucial Japanese candlestick patterns every trader should recognise and use confidently in 2025.

A Japanese candlestick pattern forms when a single candle or a series of candles visually represents price movements over a specified period. Each candlestick consists of four components: the open, high, low, and close prices for that period.
The candle's body reflects the distance between the open and close. If the close is higher than the open, the candle is bullish (typically white or green). If the close is lower than the open, the candle is bearish (black or red). The "wicks" or "shadows" show the high and low points of the session.
By studying the shapes, positions, and sequences of these candles, traders can gauge momentum shifts, market psychology, and potential future price direction.

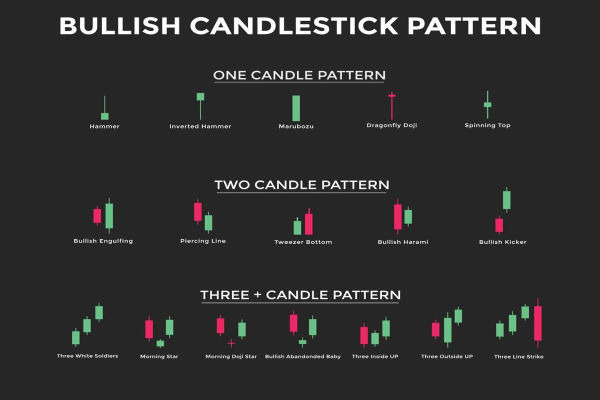
1. Hammer
The hammer is a single-candle bullish reversal pattern that appears after a downtrend occurs. It features a small body near the top of the candle, accompanied by a long lower wick.
This formation indicates that sellers initially pushed prices down, but buyers regained control and pushed the price back up before the close. Hammers often signal that a trend reversal may be imminent, especially when followed by a bullish confirmation candle.
2. Inverted Hammer
The inverted hammer is the opposite of the hammer, with a small body at the bottom and a long upper wick. Like the hammer, it forms after a downtrend and signals a potential bullish reversal.
The long upper shadow indicates that buyers attempted to take control during the session but were not strong enough to close at the high. A stronger bullish candle following the inverted hammer confirms the reversal setup.
3. Shooting Star
The shooting star is a bearish reversal pattern that occurs at the peak of an uptrend. It has a small body near the bottom of the candle and a long upper shadow.
This indicates that buyers tried to push the price higher but ultimately failed, allowing sellers to regain control. When a shooting star is followed by a bearish confirmation candle, the likelihood of a short-term trend reversal increases.
4. Hanging Man
The hanging man looks identical to the hammer, but it appears at the top of an uptrend. Despite its bullish appearance, it is considered a bearish reversal pattern.
This formation suggests that sellers are starting to gain momentum, even though buyers managed to close the price near the opening level. If followed by a red candle, traders often consider exiting long positions or entering short positions.
5. Bullish Engulfing
It is a two-candle pattern where a small, bearish candle is followed by a larger, bullish candle that completely engulfs the body of the previous one. It typically forms at the end of a downtrend and suggests a shift in momentum from sellers to buyers.
The bullish engulfing pattern signals increased buying interest and often precedes a stronger uptrend if confirmed by increased volume or further bullish candles.
6. Bearish Engulfing
The bearish engulfing pattern is the inverse of its bullish counterpart. A small bullish candle is followed by a larger bearish one that fully encompasses it. This forms at the end of an uptrend and implies that sellers are overpowering buyers.
This pattern signals a potential price drop and is more effective when accompanied by high volume and other technical indicators pointing to overbought conditions.
7. Doji
A doji forms when the open and close prices are virtually equal, resulting in a candle with a very small or non-existent body. It often looks like a plus sign or cross and signifies indecision in the market.
Doji patterns can appear during both trends and consolidations. On their own, they're neutral, but when they appear after a prolonged move and are followed by a reversal candle, they become powerful reversal signals.
8. Morning Star
The morning star is a three-candle bullish reversal pattern. It consists of:
A large-bearish candle
A small-bodied candle (could be a doji or spinning top)
A large bullish candle that closes above the midpoint of the first candle
This combination suggests that selling pressure is subsiding and buyers are taking control. The morning star pattern is most effective when it appears at a key support level or after a massive downtrend.
9. Evening Star
The evening star is the bearish counterpart to the morning star. It comprises:
A large bullish candle
A small-bodied candle showing indecision
A large bearish candle that closes below the midpoint of the first candle
This pattern often signals the exhaustion of an uptrend and is considered a reliable indicator of a bearish reversal, especially when volume confirms the shift in momentum.
10. Harami
The harami is a two-candle pattern where a large candle is followed by a much smaller one that fits within the range of the first. It comes in two versions:
Bullish Harami: Appears after a downtrend. The first candle is large and bearish, followed by a smaller bullish candle.
Bearish Harami: Appears after an uptrend. The first candle is large and bullish, followed by a smaller, bearish candle.
The harami pattern suggests a slowdown in momentum and possible reversal. Traders often wait for confirmation before acting on a harami signal.
| Aspect | Japanese Candlestick Patterns | Western Chart Patterns |
|---|---|---|
| Origin | Developed in 18th-century Japan by rice traders | Developed and popularised in Western technical analysis |
| Timeframe Focus | Short-term (intraday to daily) | Medium to long-term (daily to weekly) |
| Structure | Single candle or small sequence of candles | Multi-bar or multi-period formations |
| Examples | Hammer, Doji, Engulfing, Morning Star, Shooting Star | Head and Shoulders, Double Top/Bottom, Triangles, Flags |
| Interpretation Style | Emphasis on market psychology and real-time sentiment | Focus on pattern completion and breakout/target measurements |
| Signal Type | Often reversal signals (but also continuation patterns exist) | Can be reversal or continuation depending on the pattern |
| Confirmation | Confirmation usually comes from the next 1–2 candles | Confirmation often comes from a breakout or volume surge |
| Visual Simplicity | Easy to recognize visually with fewer bars | More complex, requiring patience and structural identification |
| Best Used With | Indicators (RSI, MACD), support/resistance levels | Trendlines, moving averages, volume, support/resistance zones |
| Speed of Signal | Fast, real-time insights | Slower, requires full formation before confirmation |
| Common Use in | Day trading, scalping, swing trading | Swing trading, position trading |
| Psychological Insight | High — reflects emotions of buyers and sellers in each candle | Moderate — focuses more on price structure than immediate sentiment |
Japanese candlestick patterns focus on short-term sentiment shifts and are often used for identifying reversal or continuation setups. In contrast, Western chart patterns such as double tops, head and shoulders, or flags focus on broader structural formations and price targets.
While candlestick patterns can offer quicker signals, they are usually more effective when used in tandem with larger trend structures and macro views.
Despite the rise of algorithmic trading and advanced indicators, candlestick patterns are still a fundamental part of price action analysis. Here's why they continue to be relevant in modern trading:
1. Visual Clarity: Candlestick patterns convey the dynamics between buyers and sellers at a glance without the need for additional tools.
2. Timeless Psychology: Human emotions—namely fear and greed—continue to influence market movements, and these patterns reflect that behaviour.
3. Compatibility: Candlesticks are effective across various timeframes and asset classes.
4. Ease of Learning: Even beginners can easily recognise basic candlestick shapes and start developing intuitive trading strategies.
As markets evolve, a solid understanding of candlestick formations provides traders with a timeless advantage, regardless of the indicators or platforms they employ.
In conclusion, learning Japanese candlestick patterns is like learning a new language—once you're fluent, you can "read" the market's story and anticipate its next move. Whether you're swing trading stocks or scalping forex pairs, recognising these 10 key patterns can help improve your entries, manage your exits, and reduce emotional decisions.
However, no candlestick pattern guarantees profits. Use them in conjunction with broader technical analysis, proper risk management, and a disciplined mindset. Over time, this holistic approach will lead to more confident and consistent trading outcomes.
Disclaimer: This material is for general information purposes only and is not intended as (and should not be considered to be) financial, investment or other advice on which reliance should be placed. No opinion given in the material constitutes a recommendation by EBC or the author that any particular investment, security, transaction or investment strategy is suitable for any specific person.