In technical analysis, candlestick patterns play a crucial role in identifying potential reversals or continuations in price trends. Among the most reliable bullish reversal patterns is the Three Outside Up candlestick pattern.
Recognised by traders in forex, equity, and commodity markets, this formation signals a potential shift from a negative perspective to positive momentum.
This article explores everything you need to know about the Three Outside Up pattern: what it is, how it works, trading strategies, examples, and common mistakes to avoid.
What Is the Three Outside Up Candlestick Pattern?
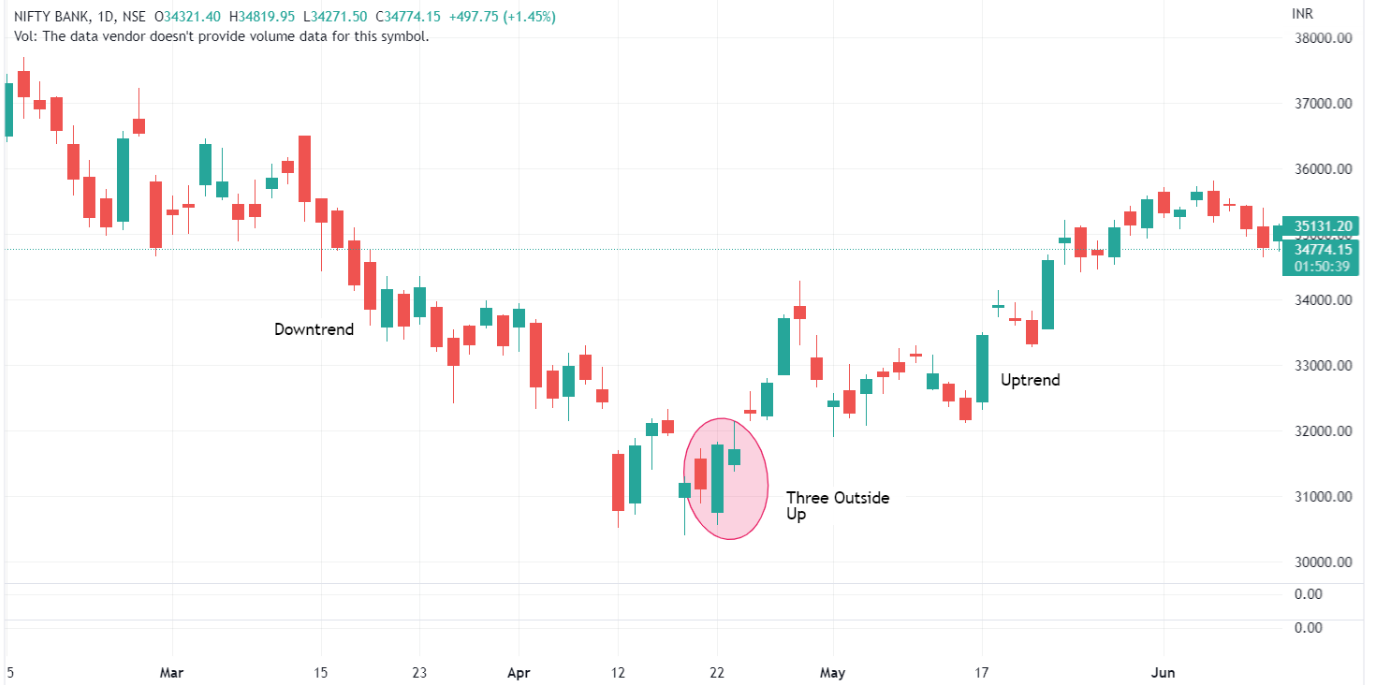
The Three Outside Up candlestick pattern is a three-bar bullish reversal pattern that typically forms at the end of a downtrend. It suggests that sellers have relinquished control, and buyers are starting to take over, possibly changing the trend.
The pattern consists of:
A bearish candle (red/black)
A bullish candle (green/white) that fully engulfs the previous candle's body
Another bullish candle closes above the second candle's close
It combines the principles of the bullish engulfing pattern and confirmation of a reversal with the third candle.
Characteristics
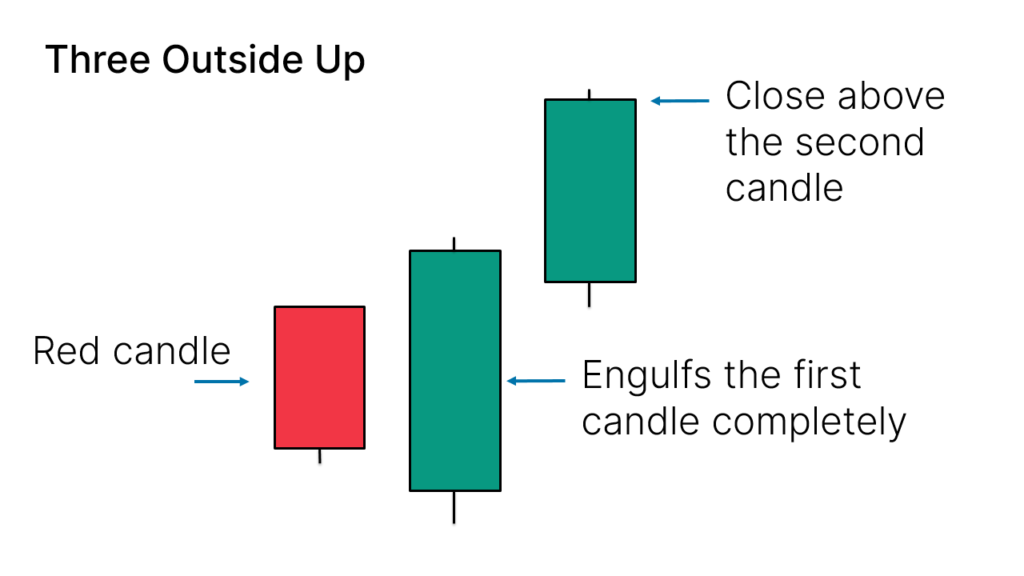
To qualify as a valid Three Outside Up pattern, the following conditions should be met:
First Candle: A bearish (red) candle appears in a downtrend.
Second Candle: A large bullish candle completely engulfs the first.
Third Candle: Another bullish candle closes higher than the second candle's close, confirming the reversal.
Volume confirmation (i.e., higher volume on the second and third candles) often strengthens the reliability of the pattern.
Three Outside Up in Different Markets
This pattern works across all markets where candlestick charts are applicable. However, nuances differ:
Forex
Works best on higher timeframes (4H, Daily)
Popular pairs: EUR/USD, USD/JPY, GBP/USD
Use in conjunction with RSI, moving averages, or price action levels
Stocks
Use daily or weekly charts
Combine with volume indicators
Avoid during earnings season unless confirmed by volume
Commodities
Crude oil, gold, and silver react well to this pattern on 1H or daily charts
Watch for macroeconomic news alignment
Differences Between Three Outside Up and Other Patterns
| Pattern |
Key Feature |
Trend Context |
Confirmation Needed |
| Three Outside Up |
Engulfing + third bullish candle |
Bearish trend |
Third candle |
| Bullish Engulfing |
Bullish candle engulfs bearish one |
Bearish trend |
No third candle |
| Morning Star |
Three candles: Bearish, Doji/Small, Bullish |
Bearish trend |
Third candle required |
| Tweezer Bottom |
Two candles with equal lows |
Short-term reversal |
Not always reliable |
How to Trade the Three Outside Up Pattern
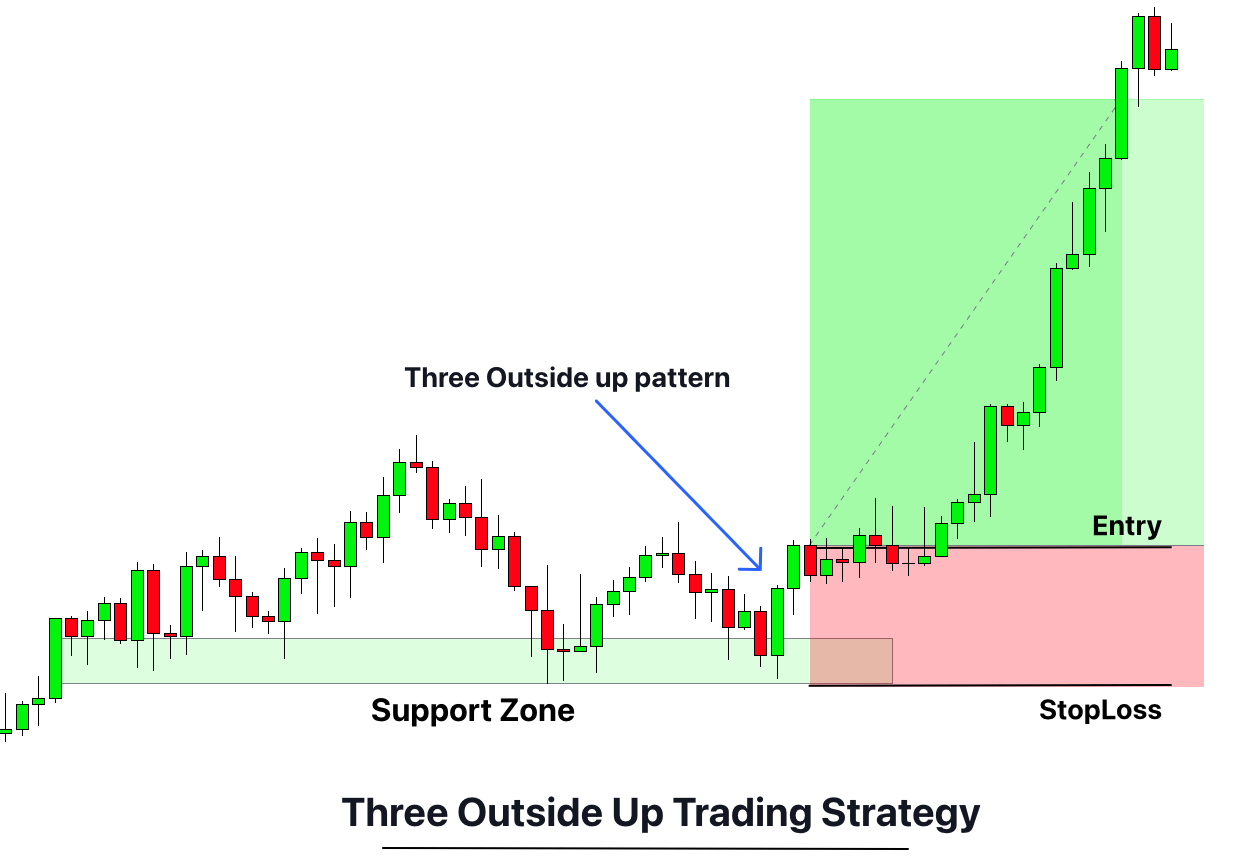
Step 1: Confirm the Pattern
Ensure the three candles meet all criteria:
The second candle must engulf the first.
The third candle must close above the second.
Preferably, volume increases on the second and third candles.
Step 2: Entry Point
Step 3: Stop-Loss Placement
Step 4: Take-Profit Targets
Use nearby resistance zones
Fibonacci retracement extensions
The risk-reward ratio of 1:2 or 1:3
Practical Example
Imagine stock XYZ is in a downtrend and forms the following candles:
Day 1: Closes at $48 (bearish)
Day 2: Opens at $47.90, closes at $49.20 (bullish, engulfing the previous candle)
Day 3: Opens at $49.30, closes at $50.10
The pattern is confirmed on Day 3. A trader might enter at $50.15 (fourth candle open), place a stop-loss at $47.80 (below Day 1's low), and aim for a 1:3 reward, say $53.00.
If the pattern forms at support or near an RSI reading below 30, it further increases the setup's reliability.
When Not to Use the Pattern and Best Practices
Avoid trading the Three Outside Up pattern under these conditions:
Low liquidity instruments: Wide spreads can distort the pattern
Before major news events: Patterns can fail due to volatility
Intraday noise: On 1-minute or 5-minute charts, false signals are more common
Overbought market: If RSI is above 70, the upside might be limited
Best Tips for Beginners
To maximise your chances of success:
Look for the pattern at the end of downtrends
Confirm with other indicators (RSI, MACD, support zones)
Use proper position sizing
Avoid entering trades without a defined exit plan
Practice in a demo account before going live
Conclusion
In conclusion, the Three Outside Up candlestick pattern is a powerful bullish reversal signal when used correctly and in a suitable market context. With its foundation in the bullish engulfing pattern and confirmation from a third strong candle, it offers a reliable way for traders to spot early trend reversals.
Like any trading tool, it works best when combined with volume analysis, momentum indicators, and disciplined risk management. Whether you're trading forex, stocks, or commodities, mastering this pattern can add a valuable edge to your trading strategy.
Disclaimer: This material is for general information purposes only and is not intended as (and should not be considered to be) financial, investment or other advice on which reliance should be placed. No opinion given in the material constitutes a recommendation by EBC or the author that any particular investment, security, transaction or investment strategy is suitable for any specific person.


