Volume is a critical yet often underappreciated part of technical analysis. While price action tells you what is happening, volume can help you understand why it's happening and how strong that move might be. Volume indicators provide traders with important signals—whether it's confirming trends, highlighting potential reversals, or identifying accumulation zones.
Below are five of the most effective volume-based indicators used in trading today. Each one offers a unique lens through which traders can interpret market activity.
On-Balance Volume (OBV)
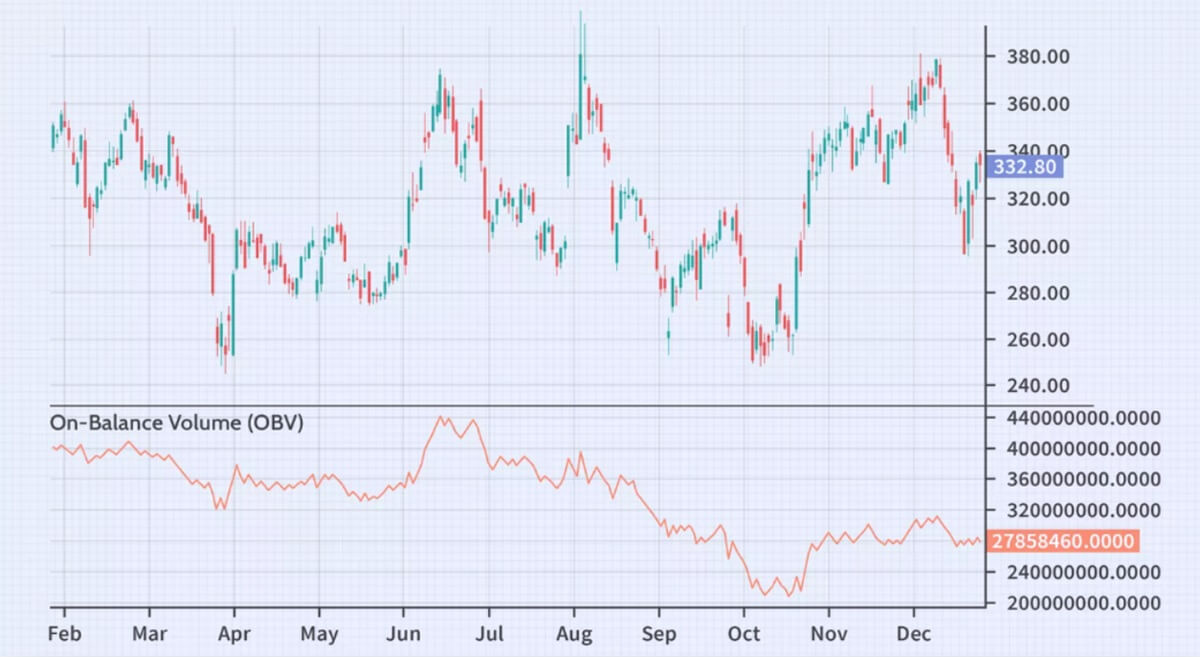 OBV reflects cumulative volume flow
On-Balance Volume (OBV) tracks buying and selling pressure by adding volume on up days and subtracting volume on down days. It generates a running total that reflects net volume movement over time.
How it signals trends
If price is rising and OBV is also rising, it confirms bullish momentum.
If price rises but OBV declines, it may indicate hidden weakness.
When to use OBV
OBV is particularly helpful for spotting bullish or bearish divergences—a classic early warning signal of trend changes. It's best used in trending markets or when looking to confirm breakout setups.
Volume-Weighted Average Price (VWAP)
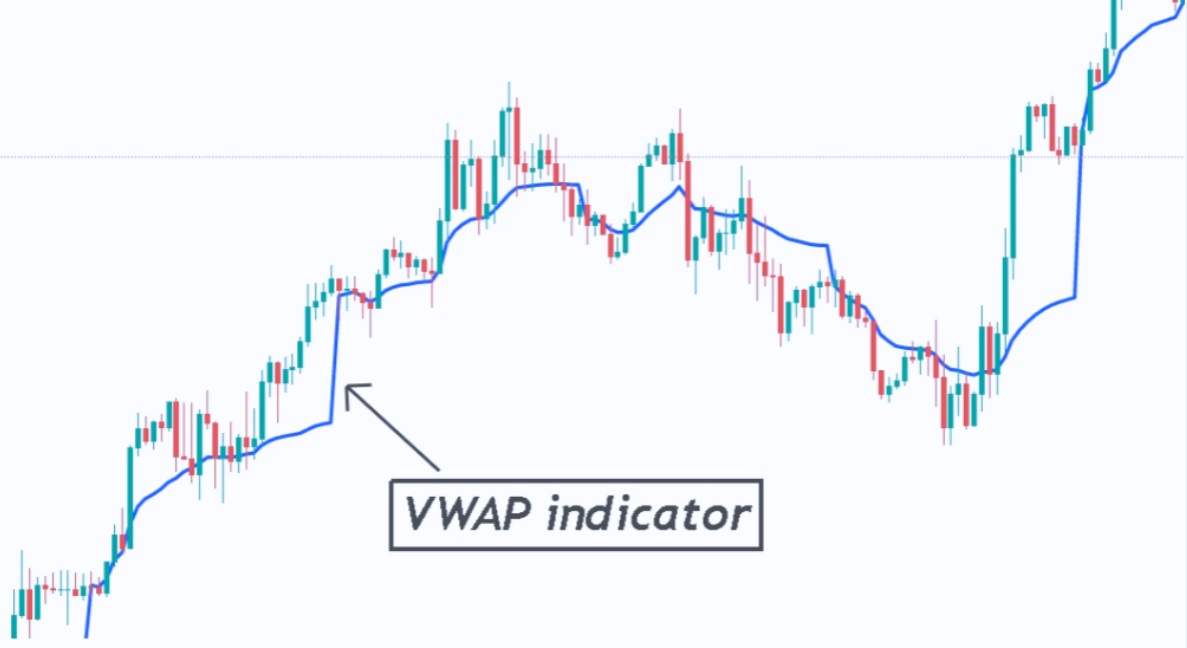 VWAP shows fair value throughout the day
VWAP calculates the average trading price over a period, weighted by volume. It resets daily, making it an essential intraday tool for traders.
Practical interpretation
How traders use VWAP
Why it matters
VWAP acts like a magnet for price during the trading session, often serving as dynamic support or resistance. It's highly effective for timing entries and exits within the day.
Accumulation/Distribution (A/D) Line
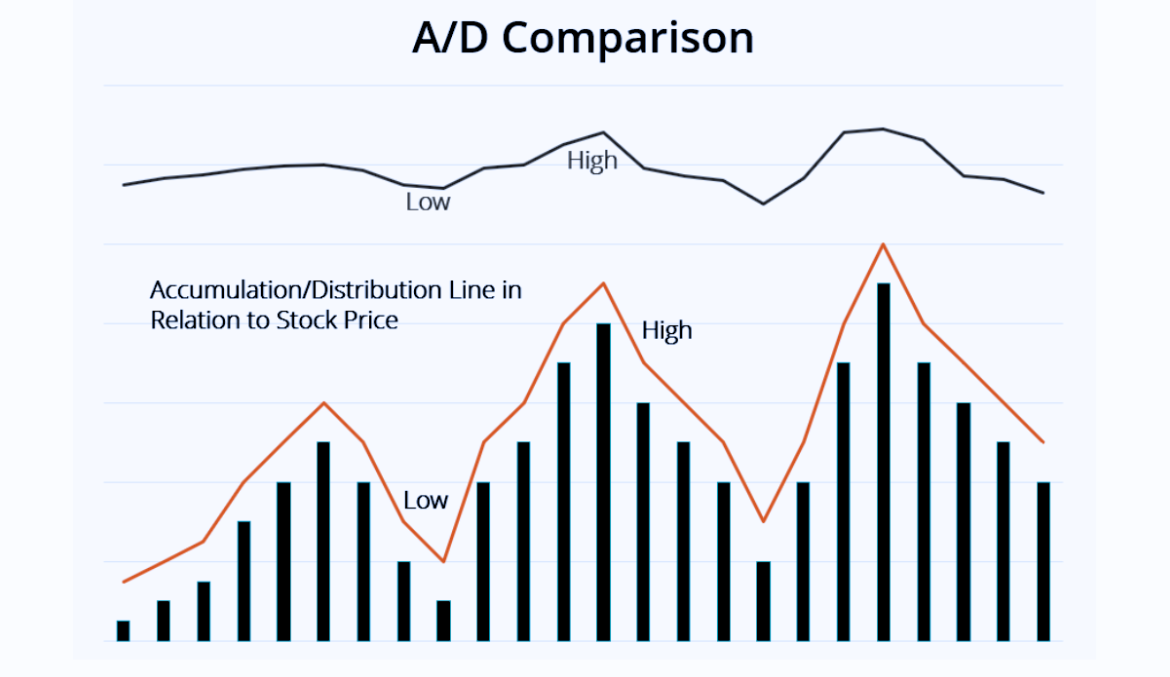 A more nuanced take on volume and price
The A/D Line factors in not only volume but also where price closed within the day's range. This makes it a more sensitive indicator compared to OBV.
Interpretation guide
Reading the A/D Line
When to rely on A/D
This indicator is valuable when you want to detect underlying buying or selling activity not yet visible in price. It's often used to validate trend strength and detect divergence ahead of breakouts.
Chaikin Money Flow (CMF)
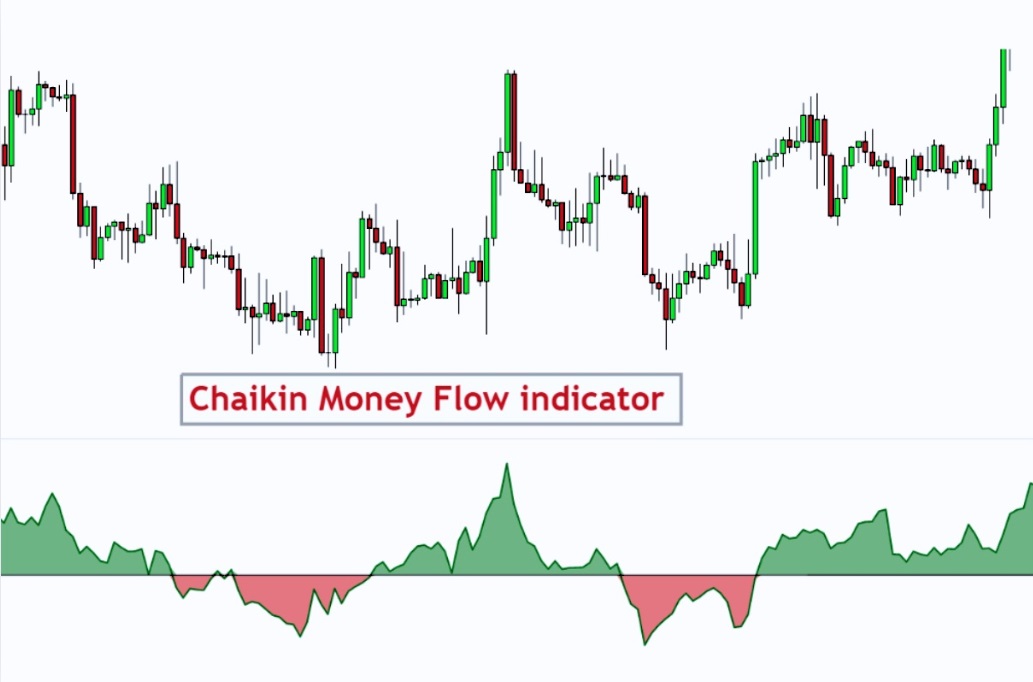
An oscillator that measures money flow strength
CMF builds on the A/D concept but turns it into an oscillator that moves between +1 and -1. It factors in both volume and closing price position within the range.
Key signals
How traders use CMF
Strength of CMF
Its ability to measure trend momentum over 20–21 periods makes CMF suitable for swing and positional traders looking for cleaner signals than traditional volume bars.
Volume Profile
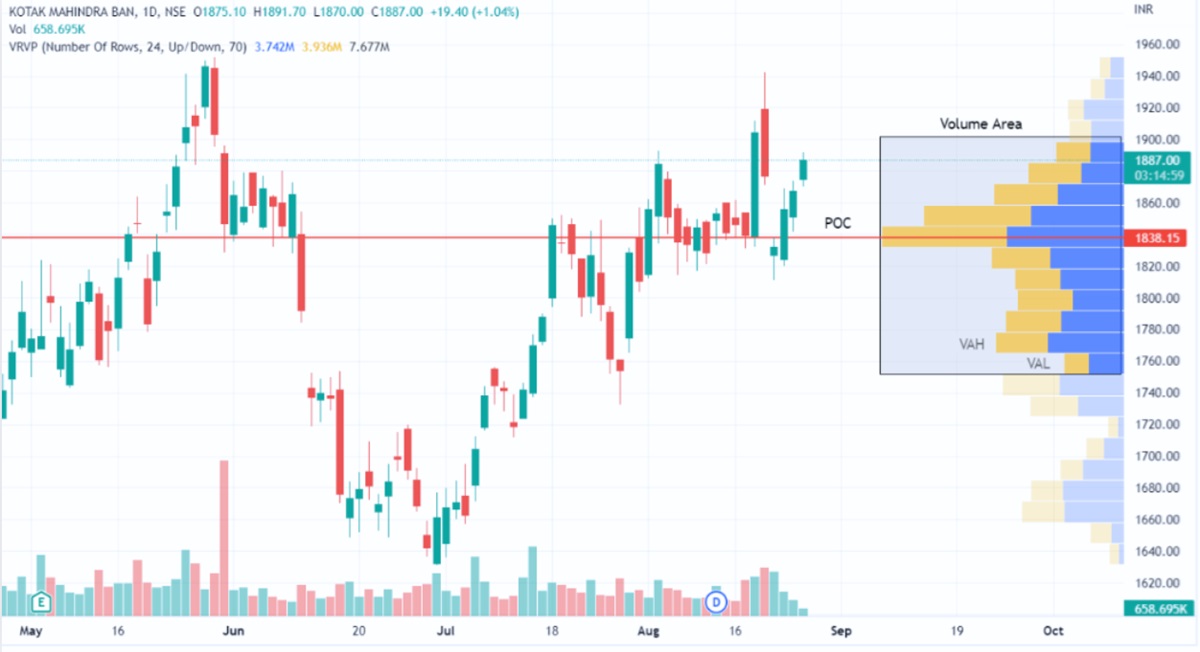 Volume by price, not by time
Unlike typical indicators that plot volume over time, Volume Profile maps out where volume was traded across different price levels. It helps identify market structure and "value areas."
Key concepts
High Volume Nodes (HVNs): strong acceptance zones, often act as support/resistance.
Low Volume Nodes (LVNs): rejection zones where price moved quickly.
Use cases
Ideal for advanced traders
Volume Profile is popular with swing traders and institutional players who want to understand which price levels matter most rather than just the timing of volume spikes.
Final Thoughts
Volume indicators offer far more than a confirmation tool—they provide unique insight into market psychology. The most effective approach often involves using them in combination.
Use OBV or A/D Line to confirm trend direction.
Apply VWAP during intraday sessions to find precise entry zones.
Monitor CMF for shifts in buying/selling momentum.
Analyse Volume Profile to locate key price zones with institutional interest.
Choosing the right volume indicator depends on your trading style and time horizon. Whether you're a scalper or a long-term trader, incorporating volume into your strategy can help you better time trades and avoid false signals.
Disclaimer: This material is for general information purposes only and is not intended as (and should not be considered to be) financial, investment or other advice on which reliance should be placed. No opinion given in the material constitutes a recommendation by EBC or the author that any particular investment, security, transaction or investment strategy is suitable for any specific person.


