Published on: 2025-07-07 Updated on: 2025-09-26

In stock market analysis, few indicators are as crucial as trading volume. Volume offers a vital perspective on market behaviour, assisting traders and investors in gauging the level of interest in a specific stock, sector, or the broader market at any moment. While price action tells you what is happening, volume often explains why it's happening.
Whether you're a beginner looking to build a foundation or a seasoned trader refining your strategies, this comprehensive guide will explain what volume means in the stock market, why it matters, and how to interpret it to improve your trading decisions.

Volume in the stock market refers to the total number of shares or contracts traded in a given security or market during a specified period. It tells you how actively a stock is being bought and sold.
For example, if 1 million shares of Apple (AAPL) were traded today, the trading volume for AAPL is 1 million. This figure includes both buyers and sellers, as every trade involves two parties.
Volume data is provided for different timeframes—minute, hourly, daily, weekly—and is typically shown in histogram format beneath price charts.
Volume is recorded and reported by stock exchanges in real time. Each transaction—whether it's 100 shares or 100,000 shares, contributes to the total volume.
There are two primary types of volume:
Total Volume: The raw number of shares traded during a period.
Average Volume: The average number of shares traded over a set number of days, typically 20 or 50.
For instance, if a stock typically has an average daily volume of 2 million shares but suddenly rises to 6 million, traders interpret it as a significant indicator that new information or investor interest has surfaced.
Higher volume typically indicates improved liquidity, which relates to how effortlessly you can open or close a position without impacting the stock's price.
Stocks with high volume:
Offer tight bid-ask spreads
Exhibit smoother price movements
Allow larger trades without slippage
On the other hand, stocks with low trading volumes may exhibit large spreads, price discrepancies, and increased volatility, rendering them more risky for trading or investing, particularly for beginners.
Volume plays a critical role because it validates the strength of price movements. A price rise or fall with high volume suggests strong interest and conviction behind the move. Conversely, a significant price move on low volume might indicate a lack of broad participation, making the move more vulnerable to reversal.
In essence, volume acts as a confirmation tool:
Rising volume during an uptrend suggests the trend is likely to continue
Falling volume may signal weakening momentum or consolidation
Spikes in volume often precede major price reversals or breakouts
Understanding volume helps investors gauge liquidity, confirm trends, and even detect manipulation or abnormal trading behaviour.

In bullish markets, volume tends to expand during rallies and contract during pullbacks. It shows strong buying interest and supports continued upside.
In bear markets, volume often spikes during selloffs as panic and fear drive decisions. These high-volume selloffs may eventually lead to market bottoms.
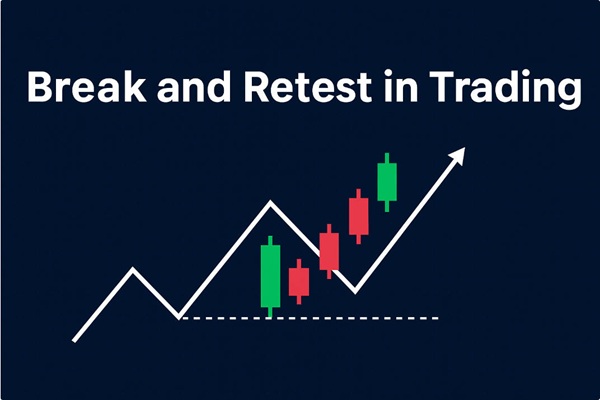
In addition, volume becomes especially important during breakout and reversal scenarios. Here's how it plays out:
During a breakout above a resistance level, high volume confirms that buyers are in control and that the move is likely to continue.
Breakouts on low volume are often viewed with scepticism and may result in a false breakout.
Similarly, volume spikes at the bottom of a downtrend may indicate capitulation, a signal that sellers are exhausted and a reversal is imminent.
Volume acts like a spotlight, highlighting whether market participants are truly behind a move or not.

Analysing volume alongside price helps traders uncover the true sentiment behind a market move. Here's how to interpret various volume-price combinations:
It is a strong bullish signal. Increased participation supports the upward move, suggesting that institutional investors may be buying.
It may indicate buyer fatigue. Fewer participants are supporting the rally, signalling potential weakness or a looming pullback.
A strong bearish signal. High volume during a decline shows panic selling or institutional distribution.
Suggests a weakening downtrend. Sellers are losing momentum, and a reversal could be near.
Let's consider a real example using a hypothetical stock, ABC Corp.
The stock has been fluctuating between $45 and $50, showing low trading volume (approximately 500K shares daily).
One day, ABC breaks out above $50 on volume of 2 million shares.
This surge in volume confirms the breakout, signalling strong demand and prompting traders to go long.
Over the next few weeks, the stock rallies to $60, validating the volume-based entry.
Had the breakout occurred on low volume, traders might have viewed it as a false breakout and avoided taking a position.
Volume can be integrated into virtually any trading strategy, whether you are trend-following, scalping, or swing trading.
For beginners:
Use volume to confirm breakouts or breakdowns
Watch for volume divergences to anticipate reversals
Combine volume with indicators like RSI, MACD, or Bollinger Bands for confluence
Volume should not be used in isolation but as a supporting indicator to increase the probability of successful trades.
In conclusion, volume is more than just a number, it is the heartbeat of the market. It indicates the level of confidence driving price changes, points out possible reversal moments, and validates trends or breakouts. Whether you're investing long term or actively trading short-term patterns, understanding volume is essential.
Mastering volume analysis won't happen overnight, but with consistent study and practice, it becomes an invaluable tool in your trading arsenal.
Disclaimer: This material is for general information purposes only and is not intended as (and should not be considered to be) financial, investment or other advice on which reliance should be placed. No opinion given in the material constitutes a recommendation by EBC or the author that any particular investment, security, transaction or investment strategy is suitable for any specific person.