Published on: 2025-06-30

In the world of technical analysis, traders often seek methods that combine mathematical precision with pattern recognition to identify high-probability trading opportunities. One of the more sophisticated approaches in this domain is the use of harmonic patterns. These geometric price patterns are based on Fibonacci ratios and help traders anticipate potential reversals in the market.
Among the wide range of harmonic patterns, several "classic" formations have stood the test of time and are widely used in forex, commodities, and equities trading. This article explores the most well-known harmonic patterns—AB=CD, Gartley, Bat, and Butterfly—and how they can be applied to your trading strategy.
 Harmonic patterns are price formations that utilise Fibonacci retracement and extension levels to forecast future market movements. Developed initially by H.M. Gartley in the 1930s and later refined by others like Scott Carney, these patterns are grounded in the belief that financial markets move in repetitive waves or cycles, often aligning with natural ratios.
Unlike simple Chart Patterns like head-and-shoulders or triangles, harmonic patterns require precise measurement of price legs and strict adherence to Fibonacci levels to validate the setup. The beauty of harmonic patterns lies in their predictive nature—they not only show where a reversal might happen but also indicate the specific price level where it is likely to occur, known as the Potential Reversal Zone (PRZ).
Classic harmonic patterns typically follow a five-point structure: X–A–B–C–D, with each leg corresponding to particular Fibonacci levels. Correctly identifying these patterns enables traders to enter trades with tight stop-losses and clearly defined risk-to-reward ratios.
 The AB=CD pattern is the most fundamental harmonic structure and often serves as a building block for more complex patterns. It consists of four points (A, B, C, and D) and three legs: AB, BC, and CD. The defining characteristic is that the length of AB equals CD, both in terms of price movement and, ideally, time.
Key Features:
BC retracement: Usually 61.8% or 78.6% of AB.
CD extension: Mirrors AB (hence AB = CD).
D point: Marks the potential reversal zone.
There are bullish and bearish versions. In a bullish AB=CD, price descends to point D before reversing upwards. In the bearish version, price ascends and reverses at D. Traders often wait for additional confirmation at D—such as a candlestick pattern or oscillator divergence—before entering a trade.
This pattern is particularly useful in trend correction scenarios, offering clean, symmetrical setups.

The Gartley pattern, introduced in H.M. Gartley's book Profits in the stock market, is one of the most recognised harmonic patterns. It closely resembles the AB=CD pattern but includes an extra leg—XA—forming a five-point structure: X–A–B–C–D.
Key Fibonacci Rules:
B retracement: 61.8% of XA.
BC retracement: 38.2%–88.6% of AB.
CD extension: 127%–161.8% of BC.
D point: 78.6% retracement of XA.
The Gartley pattern indicates a trend continuation after a temporary retracement. A bullish Gartley pattern appears in a general uptrend, suggesting a pullback before continuation, while a bearish one appears in a downtrend.
Entry is typically at point D, with a stop-loss slightly beyond X. Traders often place their take-profit orders at point B or C, depending on market momentum.

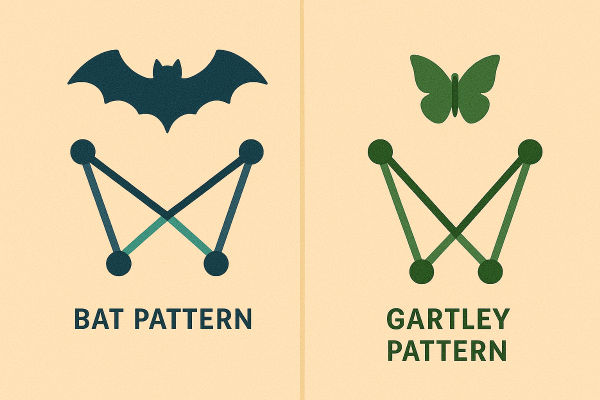
The Bat pattern was introduced by Scott Carney as a refinement of the Gartley, designed to offer higher probability setups by shifting the retracement levels. It retains the five-point structure (XABCD) but with different Fibonacci parameters.
Key Characteristics:
B retracement: Only 38.2%–50% of XA (shallower than in the Gartley).
BC retracement: 38.2%–88.6% of AB.
CD extension: 161.8%–261.8% of BC.
D point: 88.6% retracement of XA.
The Bat pattern often results in a tighter PRZ, allowing for more precise entries and smaller stop-losses. The reduced retracement depth at point B makes this pattern more conservative, increasing its reliability in choppy or corrective markets.
Traders using the Bat pattern favour it for its favourable risk-to-reward ratio, especially when supported by confluence zones or confirmation indicators.

The Butterfly pattern is another well-known harmonic formation that, unlike the Gartley or Bat, features an extension of the XA leg rather than a retracement. This pattern is particularly useful for identifying potential trend reversals at extreme price levels.
Fibonacci Structure:
B retracement: 78.6% of XA.
BC retracement: 38.2%–88.6% of AB.
CD extension: 161.8%–261.8% of BC.
D point: 127%–161.8% extension of XA.
The Butterfly pattern is considered more aggressive due to its deeper PRZ, often catching major reversals when price overshoots traditional support or resistance zones. Point D lies well beyond X, offering a unique opportunity to catch sharp price reactions.
Because of its extended structure, this pattern often aligns with high-volatility environments or news-driven markets.
Harmonic patterns offer a powerful blend of geometry, ratio-based analysis, and structure in a trading world often dominated by noise and subjectivity. When used correctly, classic patterns like AB=CD, Gartley, Bat, and Butterfly can provide high-quality trade setups with precise entry and exit zones.
However, precision is key. A pattern that almost fits the Fibonacci ratios is not a harmonic pattern. To trade these successfully, it's essential to:
Use reliable charting tools (e.g. TradingView, MetaTrader)
Understand Fibonacci retracements and extensions deeply
Combine patterns with other confirmations (e.g. volume, RSI, candlestick signals)
While they require practice and discipline, harmonic patterns reward traders with a structured, repeatable framework—bridging the gap between mathematical precision and price action psychology.
Disclaimer: This material is for general information purposes only and is not intended as (and should not be considered to be) financial, investment or other advice on which reliance should be placed. No opinion given in the material constitutes a recommendation by EBC or the author that any particular investment, security, transaction or investment strategy is suitable for any specific person.