The Ultimate Oscillator is a widely used momentum indicator that combines multiple time frames to give traders a clearer understanding of price strength.
Developed by Larry Williams, this indicator was designed to overcome the weaknesses of single-time-frame oscillators like the Relative Strength Index or Stochastic Oscillator.
By factoring in short, medium and long-term market pressures, the Ultimate Oscillator aims to offer more balanced and reliable signals, particularly useful in volatile or inconsistent markets.
How the Ultimate Oscillator Is Calculated

Unlike other momentum indicators that may produce false signals due to short-term price noise, the Ultimate Oscillator uses a weighted average of buying pressure and true range across three periods, most commonly 7, 14 and 28 days.
This blended approach is intended to reduce lag while improving the accuracy of momentum readings. For traders, this means fewer misleading overbought or oversold signals and a better chance of identifying genuine turning points in market trends.
What the Ultimate Oscillator Reveals
The calculation of the Ultimate Oscillator involves comparing the current closing price to recent lows and determining how that relates to the overall range of movement over different time frames. The result is a value that moves between 0 and 100.
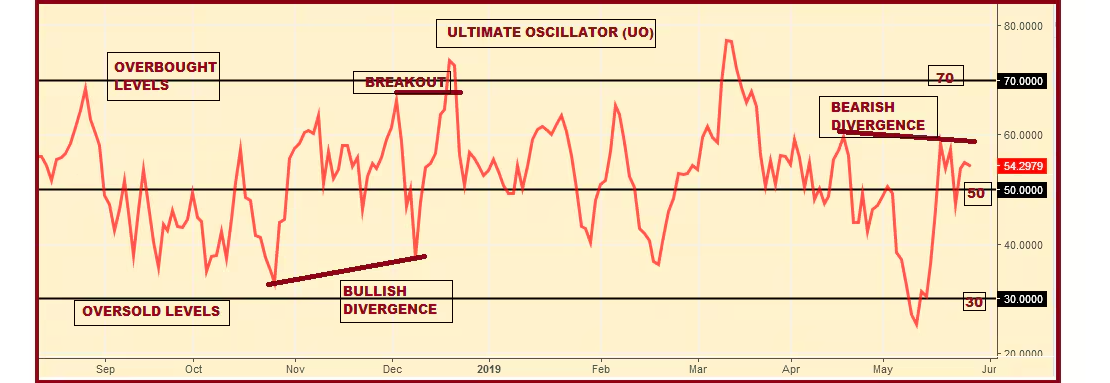
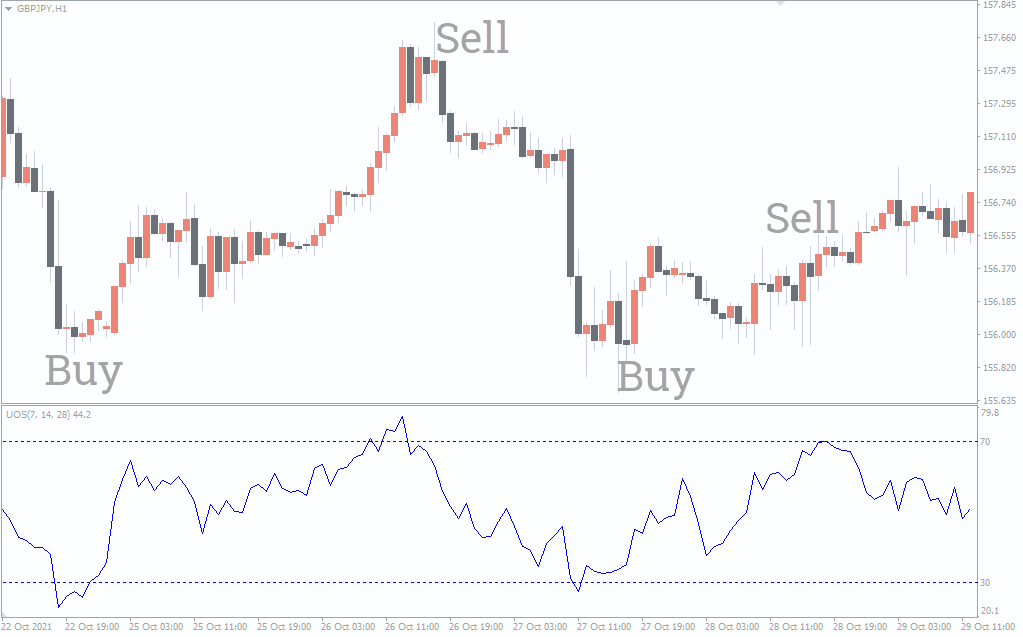
A reading above 70 typically indicates that an asset may be overbought, while a reading below 30 suggests it could be oversold. These thresholds can help traders anticipate potential reversals or pauses in trend momentum, but as with all indicators, they should be interpreted in the context of broader price action.
Using Divergence with the Ultimate Oscillator

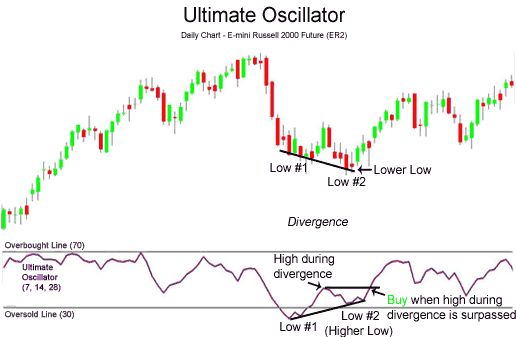
One of the most effective uses of the Ultimate Oscillator is identifying bullish or bearish divergences. A bullish divergence occurs when the price of an asset makes a new low while the oscillator fails to do the same.
This suggests that downward momentum is weakening and a reversal may be imminent. Conversely, a bearish divergence arises when the price reaches a new high but the oscillator does not, indicating that the buying strength may be fading. These divergence patterns are often used in combination with support or resistance levels to improve entry and exit timing.
Trend Confirmation and the Ultimate Oscillator
Another practical application of the Ultimate Oscillator is in trend confirmation. When an asset breaks through a key resistance level and the oscillator rises above 50 or even 70, it can signal that the breakout has sufficient momentum behind it.
On the other hand, if the price appears to be rising but the oscillator is flat or declining, it may warn that the trend is weakening and a pullback could be near. Such analysis can add confidence when deciding whether to enter a trade or stay on the sidelines.
Strengths and Limitations of the Ultimate Oscillator
The strength of the Ultimate Oscillator lies in its resistance to overreaction. Many traders appreciate that it does not spike as easily as other indicators, which means fewer false alarms during short-term price swings.
This makes it particularly helpful in range-bound markets where traditional momentum tools may mislead traders into thinking a breakout is occurring. The smoothing effect provided by the multi-timeframe calculation also ensures that traders are focusing on broader momentum trends rather than minor fluctuations.
However, like any technical indicator, the Ultimate Oscillator is not perfect. Its signals can sometimes lag behind rapid market moves, especially during news-driven events. In such cases, relying solely on the oscillator can result in missed opportunities or delayed reactions.
Moreover, while divergence can be a strong indicator, it does not always lead to immediate reversals. Traders must be patient and consider additional confirmations such as candlestick patterns, volume spikes or other indicators before acting on a divergence signal.
How to Integrate the Ultimate Oscillator into a Strategy

To get the best out of the Ultimate Oscillator, traders should consider backtesting it on their chosen markets and time frames. Some may find that adjusting the default period settings from 7, 14 and 28 to shorter or longer durations better suits their strategy.
For example, intraday traders may opt for quicker settings to reflect hourly momentum, while position traders might prefer a slower configuration to identify broader shifts over weeks. In either case, aligning the oscillator's structure with the trader's goals is essential for consistent performance.
Experienced traders often integrate the Ultimate Oscillator into a larger strategy that includes moving averages, trendlines or volume indicators. By confirming the oscillator's signals with price structure or other forms of analysis, they can reduce the likelihood of acting on misleading information.
For instance, a bullish divergence is more convincing when it coincides with a bounce off a well-defined support level. Similarly, an overbought reading is more actionable if it aligns with a known resistance zone and shows signs of reversal through price patterns.
Final Thoughts
In summary, the Ultimate Oscillator remains a valuable momentum tool for traders seeking a clearer and more balanced view of market strength. Its multi-timeframe structure helps to smooth out erratic short-term data, making it more effective at highlighting real shifts in buying or selling pressure.
While not immune to false signals or limitations, it offers advantages over simpler momentum indicators when used thoughtfully and in conjunction with broader market analysis.
Disclaimer: This material is for general information purposes only and is not intended as (and should not be considered to be) financial, investment or other advice on which reliance should be placed. No opinion given in the material constitutes a recommendation by EBC or the author that any particular investment, security, transaction or investment strategy is suitable for any specific person.


