Published on: 2025-04-16 Updated on: 2025-10-07

In forex trading, timing is everything. Gann Level is a tool designed to map potential turning points by combining both price and time. Some traders see them as a hidden edge for spotting reversals, while others view them as outdated and unreliable.
The reality depends on how they’re applied. When used with modern strategies, Gann Levels can help identify support, resistance, and trend shifts more clearly. This article explains what Gann Levels are, how they work, and how traders in 2025 can use them effectively, or simply avoid the pitfalls if they’re not the right fit.
Gann Levels are price levels and angles developed by trader W.D. Gann, based on his idea that markets follow geometric and cyclical patterns.

Rather than analyzing time and price separately, Gann combined both into a unified framework, allowing traders to map out balance points in the market, much like plotting both X and Y axis to reveal the full chart.
In practice, this is done by plotting Gann angles (like 1x1, 1x2, 2x1) or Gann retracements on charts.
These tools aim to highlight zones where price may pause, reverse, or accelerate, helping traders anticipate potential support, resistance, and trend changes.
The logic behind Gann Levels is based on balance:
Angles show the speed of price movement. A 1x1 angle suggests one unit of price for every unit of time.
Retracements divide price moves into key fractions (e.g., 1/8, 1/4, 1/2) to anticipate corrections.
Squares and cycles attempt to connect time and price for forecasting turning points.
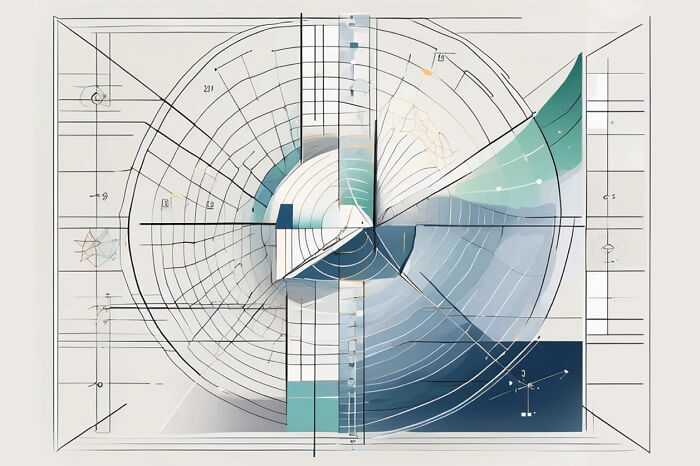
For example, in this chart, the sloping lines act like support and resistance guides.
When price stays above a line, it suggests strength, but when it drops below, it signals weakness. The vertical lines mark time points where the market could change direction, such as reversals or new trends.
This combination aims to reveal levels where the market could pause, reverse, or accelerate.
Advantages:
Help visualize balance between price and time
Provide structured support/resistance zones
Work across multiple timeframes
Useful when combined with price action and momentum tools
Limitations:
Can be highly subjective (depends on chosen swing points)
Complex for beginners to plot accurately
May generate conflicting signals in sideways markets
Best used as confirmation, not as a standalone system
The controversy surrounding Gann Levels is largely due to the esoteric nature of Gann's teachings. His methods were never fully documented, and much of his work has been left open to interpretation.
This has led to a range of conflicting opinions about the validity of his methods, including Gann Levels.
Some traders have reported success using Gann Levels, but others believe that the levels are no more accurate than any other form of technical analysis. It's worth noting that even Gann himself was not always able to predict market movements with certainty.
As with any technical trading tool, there is always a degree of uncertainty and risk involved in relying solely on Gann Levels.
Despite the controversy, some traders continue to use Gann Levels as part of their strategy. If you choose to incorporate Gann Levels into your trading, here are a few tips:
Learn the Foundations: Before applying Gann Levels, it helps to understand Gann’s broader philosophy on how markets move in cycles of price and time. This context makes the tool much clearer.
Use Them With Other Indicators: Gann Levels often work best when combined with supporting tools like moving averages, oscillators, or trendlines. This reduces the chance of acting on false signals.
Start Small and Safe: Try practicing on a demo account first. You’ll get a feel for how Gann Levels interact with live price action without risking your capital.
Wait for Confirmation: Gann Levels can highlight potential turning points, but the market doesn’t always react instantly. Patience and confirmation are key before entering trades.
Trend Identification: Angles help spot the speed of a trend and whether it’s weakening or accelerating.
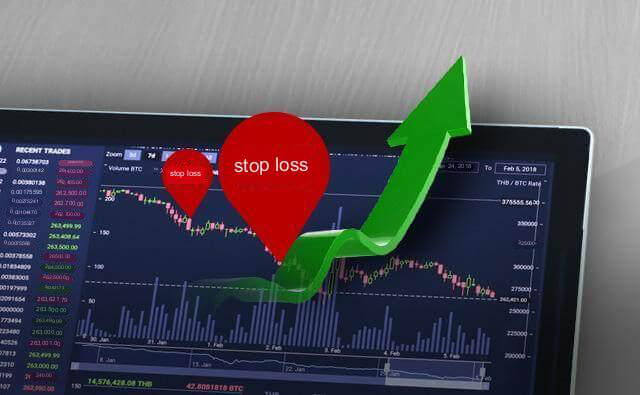
Entry & Exit Points: Retracements and angles act as support/resistance for setting stop-losses or profit targets.
Cycle Forecasting: Some traders align time cycles with price levels to anticipate reversals.
Combination Strategy: Gann Levels are often paired with RSI, MACD, or candlestick patterns for stronger confirmation.
Traders often wonder if Gann Levels can truly be trusted. Supporters argue that the geometric structure behind them offers valuable insights into potential turning points, citing Gann’s own historical success.
On the other hand, critics see them as more art than science, with results that can feel inconsistent or overly subjective.
In practice, Gann Levels may not work as a stand-alone system, but when combined with modern tools, they can add another perspective to a trader’s strategy.
This table compares how each trading indicator approaches market timing and trend analysis.
| Aspect | Fibonacci Retracements | Gann Levels | Moving Averages |
|---|---|---|---|
| Core Focus | Price ratios (retracements and extensions) | Balance of price and time | Trend smoothing |
| Goal | Identify retracement zones | Forecast turning points with timing | Show trend direction |
| Complexity | Simple and widely used | More complex, requires study | Easy to apply |
| Precision | Good for spotting zones | Potentially more precise for timing | Broad, less precise |
| Market Use | Swing levels, corrections | Reversals, accelerations | Trend confirmation |
They’re used to identify potential support, resistance, and reversal points by combining time and price analysis.
They can be useful, but reliability depends on correct plotting and confirmation with other indicators. Many traders see them as a secondary tool rather than a standalone system.
Both identify retracement levels, but Fibonacci is purely ratio-based, while Gann combines geometry, angles, and time.
Yes. Many forex traders use them to anticipate turning points in currency pairs, especially during trend corrections.
They can still be effective, but due to today’s volatility, they work best when combined with momentum indicators and strong risk management.
The Gann Levels method is often seen as both art and science.
Some traders dismiss it as abstract, while others find it surprisingly effective for anticipating price shifts.
When applied correctly, Gann Levels don’t just highlight support and resistance, they help traders plan entries and exits with greater confidence, turning market uncertainty into structured opportunities in forex trading.
Disclaimer: This material is for general information purposes only and is not intended as (and should not be considered to be) financial, investment or other advice on which reliance should be placed. No opinion given in the material constitutes a recommendation by EBC or the author that any particular investment, security, transaction or investment strategy is suitable for any specific person.
World's Best Broker