For many traders, finding reliable indicators to predict market movements is essential for success. One such tool that can be a game changer is Murrey Math Lines.
Developed by trader and analyst Terry Murrey, these lines provide a structured approach to forecasting price movements in various markets, especially in forex and commodities trading.
In this article, we will explore how Murrey Math Lines work, their key components, and how to use them to improve your trading decisions.
What Are Murrey Math Lines?

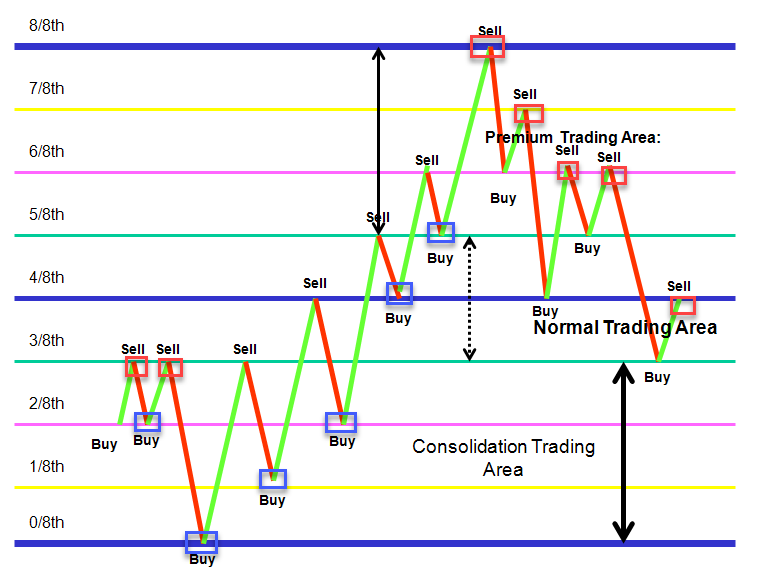
Murrey Math Lines are a set of horizontal lines drawn on a price chart that help traders identify potential support and resistance levels. These lines are based on a mathematical formula that divides the trading range into eight equal parts, each representing a significant price level. The key aspect of this system is that it relies on the idea that markets tend to move in predictable patterns, particularly at specific price levels.
The lines are derived from a principle known as Gann Theory, which suggests that markets exhibit certain cyclical patterns that can be forecasted using mathematical techniques. Murrey Math Lines take this theory further by providing a practical method of identifying price levels that are likely to act as support or resistance.
Key Components of Murrey Math Lines
Murrey Math Lines consist of eight major lines, each corresponding to specific price levels. These lines are typically plotted on a price chart and act as guides for traders. The eight lines include:
0/8 Line: This is the base level of the price range and represents the starting point for the entire calculation.
1/8 to 7/8 Lines: These represent the key price levels that act as support or resistance. Traders monitor these levels to identify potential price reversals.
4/8 Line: This is considered the most important level, as it often acts as the “neutral” point. A break above or below this line can signal a change in market sentiment.
8/8 Line: This is the top line and represents the upper extreme of the price range.
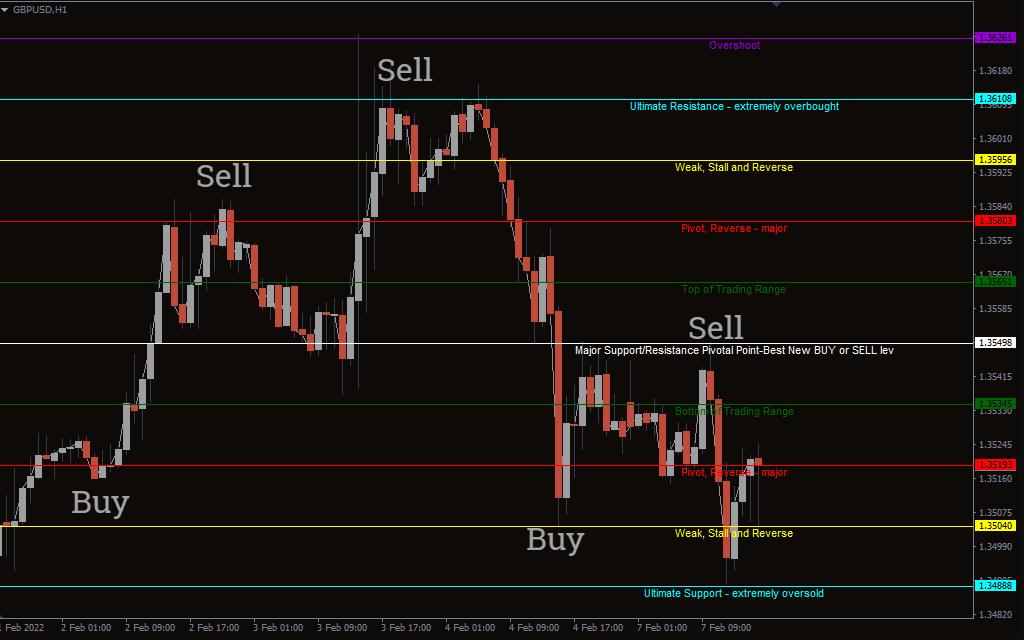
The key idea behind Murrey Math Lines is that when prices approach any of these lines, they are likely to encounter significant support or resistance. Traders use these lines to anticipate potential price reversals or breakouts.
How to Use Murrey Math Lines in Trading

To effectively use Murrey Math Lines in your trading strategy, you need to follow these steps:
Identify the Trading Range: The first step is to determine the price range you want to analyse. This could be the range from a recent high to a recent low. The larger the range, the more significant the levels will be.
Plot the Murrey Math Lines: Once you've identified the range, plot the Murrey Math Lines on your chart using a technical analysis tool. Many trading platforms offer automatic tools for plotting these lines.
Monitor the Price Action: Watch how the price behaves as it approaches each of the Murrey Math Lines. If the price hits one of the lines and reverses, it could indicate a strong support or resistance level.
Combine with Other Indicators: For more reliable signals, combine Murrey Math Lines with other technical indicators such as RSI, MACD, or moving averages. This will help confirm whether a price level is truly significant.
Advantages
Clear Support and Resistance Levels: One of the biggest advantages of Murrey Math Lines is their ability to identify clear support and resistance levels. These levels are based on a mathematical formula, which means they are objective and can be applied consistently across different markets.
Predictive Power: Murrey Math Lines can help traders predict where the price is likely to reverse, providing a significant edge when used correctly.
Versatility: Murrey Math Lines can be used in various markets, including forex, stocks, and commodities, making them a versatile tool for traders.
Limitations
While Murrey Math Lines can be extremely helpful, they are not without their limitations. One major drawback is that they are based on historical price data, which means they cannot predict future market movements with absolute certainty. Additionally, Murrey Math Lines may not always be effective in highly volatile or unpredictable market conditions.
It is also essential to note that Murrey Math Lines work best when used in conjunction with other technical analysis tools. Relying solely on these lines could lead to false signals or missed opportunities.
Conclusion
Murrey Math Lines are a powerful tool for traders looking to predict price reversals and identify key support and resistance levels. By understanding the principles behind these lines and how to use them effectively, you can enhance your trading strategy and improve your chances of success.
While they are not foolproof, Murrey Math Lines can be a valuable addition to your technical analysis toolkit, especially when combined with other indicators and market analysis techniques.
Disclaimer: This material is for general information purposes only and is not intended as (and should not be considered to be) financial, investment or other advice on which reliance should be placed. No opinion given in the material constitutes a recommendation by EBC or the author that any particular investment, security, transaction or investment strategy is suitable for any specific person.


