Missed reversals in forex? The Williams %R indicator is a momentum tool that helps traders identify overbought and oversold zones before the market turns. While simple to use, its real power comes when combined with other indicators and tested in live conditions.
This guide explains what Williams %R is, how it works, and how you can apply it effectively in 2025.
Step 1 – Understanding What Is Williams %R
Williams %R, short for Williams Percent Range, is a momentum oscillator developed by Larry Williams. It measures where the current price sits in relation to the highest high and lowest low over a chosen period, usually 14 days.

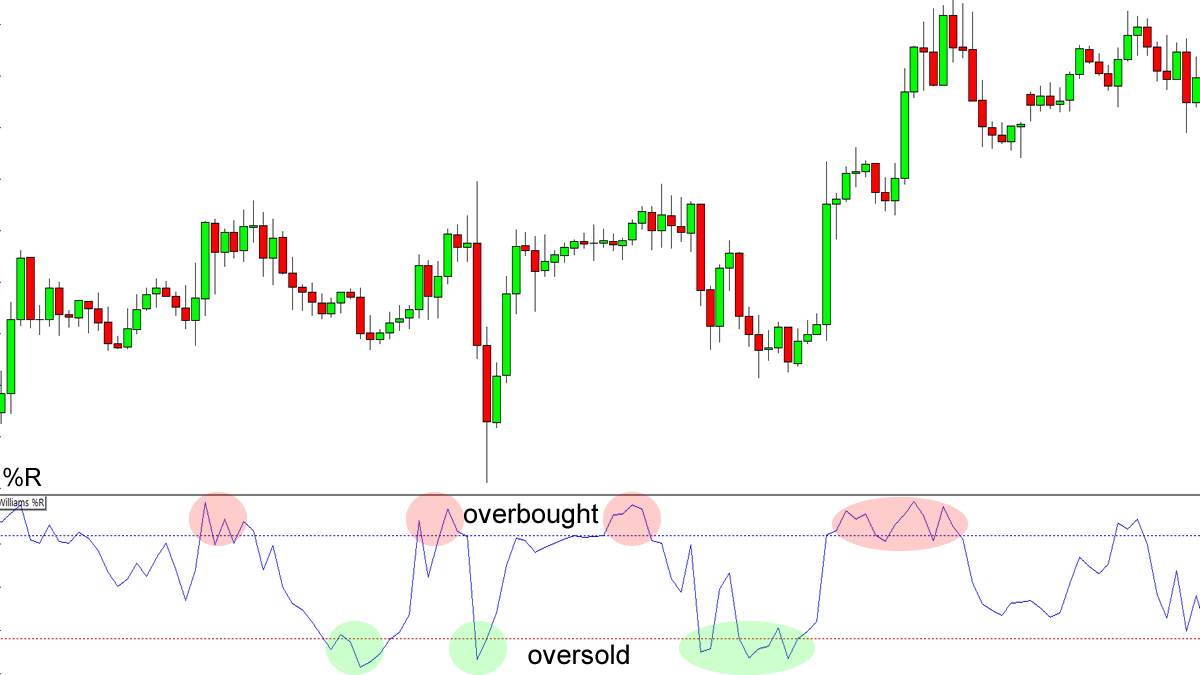
Unlike many oscillators, the scale is inverted. That means high readings indicate potential overbought conditions, while low readings suggest potential oversold levels.
Williams %R is often compared to the Stochastic Oscillator, but it has a simpler formula and a more straightforward approach.
Step 2 – Know How Williams %R Is Calculated
Use this formula:
Williams %R = Highest High - Close
______________________ x (- 100)
Highest High - Lowest Low
Highest High = Highest price in the lookback period, typically 14 days.
Close = Most recent closing price.
Lowest Low = Lowest price in the lookback period, typically 14 days.
For example: if over the past 14 bars, the highest high is 1.2000, the lowest low is 1.1800, and the current close is 1.1950:
%R = (1.2000 - 1.1950)
________________ x (- 100) = -25
(1.2000 - 1.1800)
That reading indicates the price is relatively close to its recent high, but not at an extreme overbought state.
How To Interpret Williams %R Values
The indicator highlights three zones:
Above –20 (Overbought): Market has climbed too quickly and may pull back.
Below –80 (Oversold): Market has dropped sharply and may rebound.
Between –20 and –80 (Neutral): Normal trading conditions; trend likely continues.
Remember: overbought does not always mean "time to sell," and oversold does not always mean "time to buy." It signals potential, not certainty.
Step 3 – Identify The Best Settings for Williams %R
14 periods (default): Balanced between speed and reliability.
7–10 periods: More sensitive, captures quicker swings but prone to noise.
20–30 periods: Smoother signals but slower to react.
Choose settings based on your trading timeframe. A short-term scalper may prefer faster settings, while swing traders may benefit from longer periods.
Step 4 – Interpreting the Williams %R Values
Once you add Williams %R to your chart, the next step is learning how to read it.

The indicator ranges from -100 to 0, and certain levels act as signals for potential trading opportunities:
-
Above -20 (Overbought): When Williams %R rises above -20, the market is considered overbought. This often means prices have climbed too quickly and may be due for a pullback. Traders may watch for short or sell setups here.
-
Below -80 (Oversold): When Williams %R drops below -80, the market is considered oversold. This suggests prices may have fallen too far, too fast, and a rebound could be near. Traders may watch for a long time or buy setups.
Between -20 and -80 (Neutral): When the value stays between these levels, it signals normal trading conditions. The market is neither overbought nor oversold, and price is likely to continue in its current direction.
Step 5 – Using Williams %R with Other Indicators
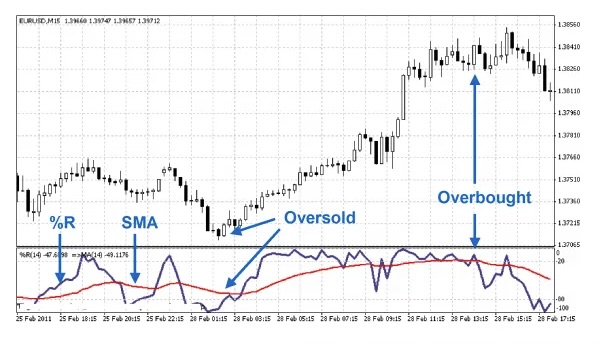
Williams %R works best when paired with other tools rather than used alone. For example, combining it with moving averages or support and resistance levels can confirm potential signals and reduce the risk of false entries.
A powerful technique is spotting divergences. If the price is making new highs but Williams %R is not, it may hint that momentum is weakening and a reversal could be around the corner.
Step 6 – Recognising Overbought and Oversold Conditions
One of the main strengths of Williams %R is its ability to highlight overbought and oversold zones. When the indicator moves above -20, it suggests the market may be overbought and due for a pullback. When it falls below -80, it signals oversold conditions and a possible rebound.
However, these signals are not foolproof. Traders should always confirm them with other tools such as moving averages, trendlines, or candlestick patterns, before making a decision.
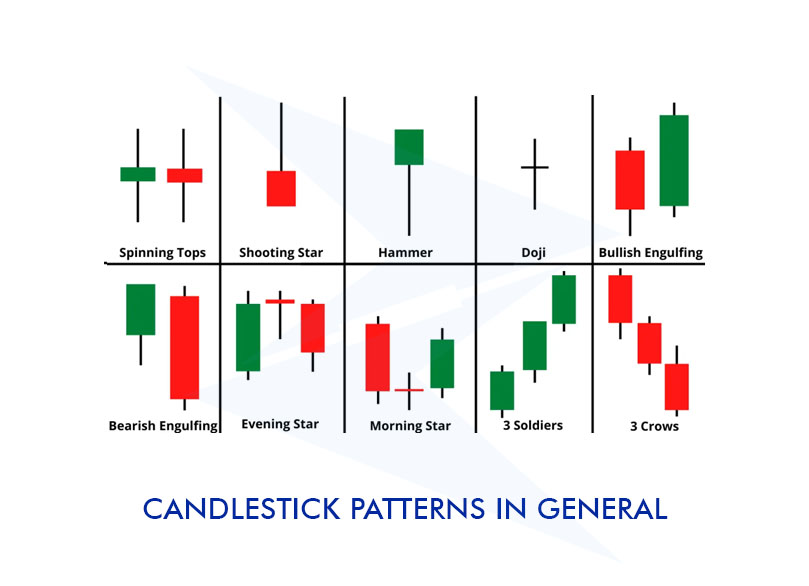
Step 7 – Combining Williams %R with Candlestick Patterns
Williams %R becomes more powerful when paired with candlestick signals.
For instance:
Oversold + Bullish Candle (hammer, bullish engulfing): A potential buy setup.
Overbought + Bearish Candle (shooting star, bearish engulfing): A potential sell setup.

This combination helps filter out false signals and improves timing for entries and exits.
Step 8 – Building a Trading Strategy with Williams %R
With these tools, traders can design simple but effective strategies:
Buy Signal: When Williams %R dips below -80 (oversold) and then crosses back above it. Confirm with trend or volume indicators.
Sell Signal: When Williams %R rises above -20 (overbought) and then turns downward. Useful for short trades or profit-taking.
Remember, Williams %R isn’t perfect. It may give false signals in volatile markets, so always combine it with risk management and other indicators.
Step 9 – Avoiding Common Mistakes with Williams %R
Many traders misuse Williams %R by treating every signal as a guaranteed trade. Some of the most common mistakes include:
Ignoring the trend: In strong bullish or bearish markets, Williams %R can remain overbought or oversold for extended periods. Always consider the bigger trend before acting.
Skipping stop-losses: No indicator is perfect. Protect your capital by setting stop-loss orders.
Overtrading signals: A reading alone isn’t enough. Wait for confirmation from other indicators or price action before entering a trade.
By avoiding these mistakes, traders can use Williams %R more effectively and with greater confidence.
Conclusion
Williams %R is a straightforward yet powerful momentum tool. On its own, it highlights overbought and oversold conditions and potential reversals through divergence. When combined with trend indicators, candlestick patterns, and disciplined risk management, it becomes a valuable part of a trader’s toolkit in 2025.
By avoiding common mistakes and using it alongside other methods, traders can sharpen entry and exit timing while reducing false signals.
Disclaimer: This material is for general information purposes only and is not intended as (and should not be considered to be) financial, investment or other advice on which reliance should be placed. No opinion given in the material constitutes a recommendation by EBC or the author that any particular investment, security, transaction or investment strategy is suitable for any specific person.


