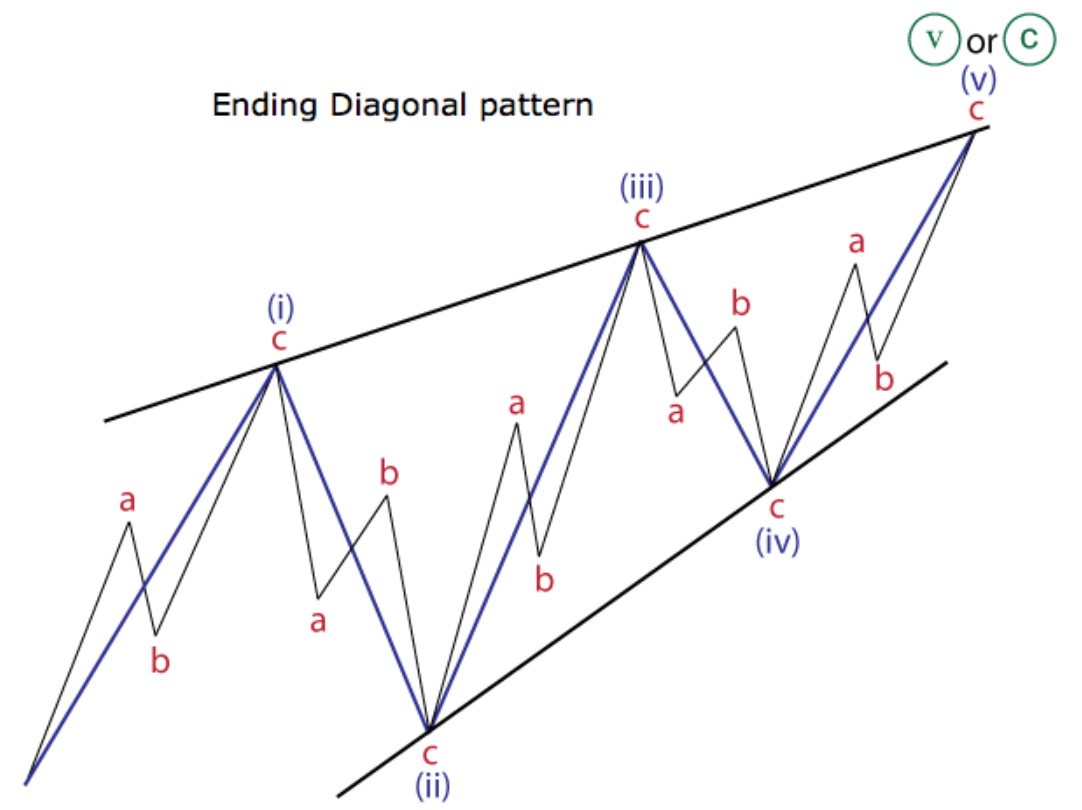
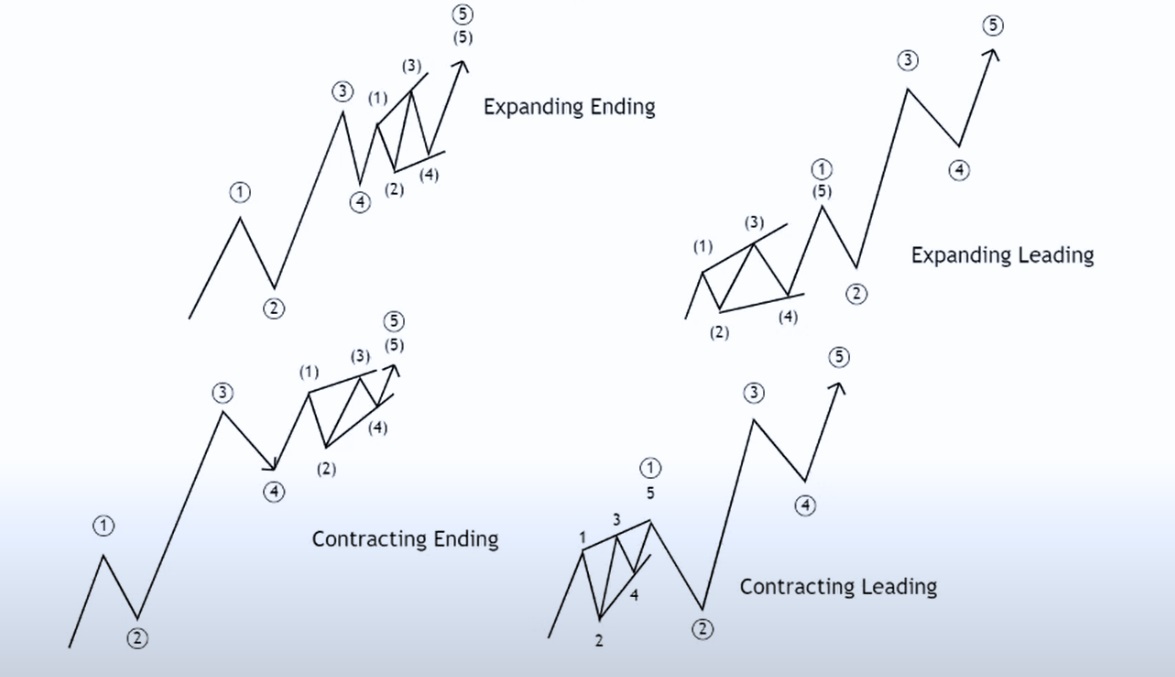
The Ending Diagonal pattern is a distinctive structure in Elliott Wave Theory, often marking the final phase of a larger market trend. Though relatively rare, its appearance signals an imminent reversal and presents valuable trading opportunities. Understanding its structure, rules, and visual cues is essential for identifying potential turning points in both impulse and corrective wave sequences.
What Is an Ending Diagonal?

An Ending Diagonal is a specific type of motive wave that typically forms in the fifth wave of an impulse or the C wave of a correction. Unlike the standard five-wave impulse, which follows a 5‑3‑5‑3‑5 structure, the Ending Diagonal consists of five waves that each subdivide into three smaller waves, forming a 3‑3‑3‑3‑3 pattern. This unique structure gives it a wedge-like appearance on the chart.
The key feature of this pattern is the shape it forms: two trendlines that either converge (contracting diagonal) or diverge (expanding diagonal). These trendlines are drawn by connecting the end points of waves 1 and 3. and waves 2 and 4. The pattern represents a market losing momentum—often after a prolonged trend—as the final push struggles to maintain the earlier pace.
Due to its placement in wave 5 or wave C, the Ending Diagonal often appears during the last stages of market sentiment, where enthusiasm or panic reaches a climax. The result is usually a sharp reversal, making it a highly valuable signal for traders anticipating trend exhaustion.
Key Rules & Structural Characteristics
The Ending Diagonal is governed by a set of structural rules that distinguish it from other wave patterns:
Volume Considerations: Volume often decreases throughout the pattern, reflecting fading momentum. However, a final volume spike at the end of wave 5—known as a "throw-over"—can signal a reversal is imminent.
These rules help traders correctly identify the pattern and distinguish it from other, similar formations that may arise during choppy or corrective phases.
Types: Contracting vs Expanding Diagonals
 Ending Diagonals can be classified into two types based on the orientation of their trendlines:
Contracting Ending Diagonal
The most common type, a contracting Ending Diagonal, features two trendlines that gradually move closer together. Wave lengths typically shrink over time, reflecting weakening market activity. This type often forms in the final stages of bullish or bearish trends and usually ends with a sharp reversal.
Features:
Trendlines converge.
Wave 1 is longer than wave 3. which is longer than wave 5.
Wave 2 and 4 retracements are relatively deep.
The throw-over (wave 5 exceeding the upper or lower trendline) is often brief but sharp.
Expanding Ending Diagonal
Far less common, the expanding Ending Diagonal exhibits trendlines that move apart. Each wave tends to be larger than the last, creating a diverging wedge. This can signal extreme market conditions, such as panic selling or euphoric buying.
Features:
Trendlines diverge.
Waves increase in length: wave 5 is longer than wave 3. which is longer than wave 1.
Greater volatility and stronger emotional reactions.
The pattern may culminate in a dramatic price movement followed by a rapid reversal.
Recognising the difference between contracting and expanding forms is crucial for managing risk and positioning trades effectively.
Where Do They Occur in Elliott Wave Structure?
Ending Diagonals are terminal patterns, meaning they only occur at the end of larger wave sequences. Their placement in the Elliott Wave hierarchy is specific:
Rarely in Wave 1 or A (as Leading Diagonals): While similar in structure, these are called Leading Diagonals and follow slightly different rules (typically a 5‑3‑5‑3‑5 structure). Ending Diagonals, by contrast, are strictly 3‑3‑3‑3‑3.
Understanding where the pattern appears is crucial to interpreting its implications. A correctly identified Ending Diagonal gives traders high confidence that a reversal or correction is on the horizon.
Visual Identification on Charts
Spotting an Ending Diagonal in real time requires a trained eye and attention to several visual cues:
Analysing historical examples on platforms like TradingView or YouTube can help traders build pattern recognition skills. When identified correctly, the Ending Diagonal provides one of the clearest setups for anticipating major market turning points.
Conclusion
The Ending Diagonal pattern, with its unique 3‑3‑3‑3‑3 structure and wedge-like shape, plays a critical role in Elliott Wave Theory. By mastering its rules, types, and visual cues, traders can anticipate powerful reversals at the end of impulse or corrective waves. Whether in wave 5 or C, recognising this terminal formation enhances timing, risk management, and trade execution—especially in volatile market conditions.
Disclaimer: This material is for general information purposes only and is not intended as (and should not be considered to be) financial, investment or other advice on which reliance should be placed. No opinion given in the material constitutes a recommendation by EBC or the author that any particular investment, security, transaction or investment strategy is suitable for any specific person.


