Published on: 2025-07-04

In technical trading, candlestick charts are a popular way to read market psychology. For traders seeking to identify trend reversals early, bearish candlestick patterns are particularly useful. These formations signal when bullish momentum is fading and when sellers may be about to take over. Understanding what bearish candlestick patterns are can help traders reduce risk, exit trades on time, and avoid being caught in reversals.
A bearish candlestick pattern reflects a potential turning point from an uptrend to a downtrend. These patterns suggest that buying pressure is weakening and that selling interest is beginning to rise. They appear on candlestick charts across multiple timeframes, from short-term trading to long-term investment views.

The core idea behind bearish candlestick patterns is that market sentiment is shifting. While price action alone does not guarantee a move downward, these patterns show how traders are beginning to lose confidence in continued price increases.
Typically, such formations occur after a steady uptrend. The price reaches a high, encounters resistance, and then begins to show signs of stalling. The candlestick pattern that forms during this phase helps traders interpret whether a downtrend may follow.
Bearish candlestick patterns are commonly used in forex, stock indices, commodities, and cryptocurrency trading. They are especially valuable when combined with other technical tools such as support and resistance levels, trendlines, or volume analysis.

One of the most widely recognised bearish candlestick patterns is the bearish engulfing. This involves two candles. The first is a smaller bullish candle followed by a larger bearish candle that completely engulfs the first one. This structure shows that sellers have entered the market with force, taking control from the buyers.
Another classic example is the shooting star. It appears as a single candle with a small body near the day's low and a long upper wick. This pattern reflects a failed attempt by buyers to push prices higher, which was quickly reversed by selling pressure before the candle closed.
The evening star is a three-candle formation often found at the top of an uptrend. The first candle is a strong bullish move. The second shows indecision, often taking the form of a doji or a small candle. The third is a large bearish candle that closes below the midpoint of the first. This structure suggests a strong reversal in sentiment and often signals a move lower.
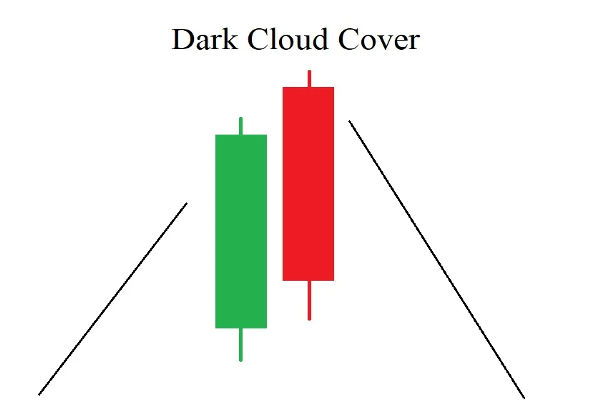
The dark cloud cover pattern involves two candles. The first is bullish, and the second opens above the first candle's close but closes below the midpoint of the previous body. This pattern shows hesitation by buyers followed by strong selling into the close, hinting at further declines.
Finally, the hanging man is a single candle with a small real body near the top and a long lower wick. It looks similar to a hammer but occurs after an uptrend rather than a downtrend. It reflects selling pressure that was ultimately overcome during the session, but its appearance can suggest underlying weakness.
The reason so many traders rely on bearish candlestick patterns is their ability to signal momentum shifts without requiring complex calculations. They offer a visual and intuitive way to read market behaviour. When these patterns appear near known resistance levels or after a strong bullish trend, they are often taken as early warning signs that the trend may be ending.
For example, spotting a bearish engulfing pattern after a strong rally may prompt traders to tighten stop-losses or consider exiting long positions. Seeing a shooting star at a weekly high may discourage further buying. The information these patterns provide can be subtle, but their value lies in their timing. They can help traders act before the wider market catches up.
Although bearish candlestick patterns can be powerful indicators, most traders do not rely on them in isolation. Instead, they are usually confirmed with additional signals. A bearish pattern near a resistance level carries more weight than the same pattern in a sideways market. Confirmation may come from a follow-up candle that continues the downward move or from indicators such as moving averages, RSI, or MACD.
When trading based on bearish candlestick patterns, traders often look for follow-through selling in the next session before committing to a trade. Stop-loss orders are usually placed above the recent highs to protect against failed signals. Patience and discipline are key to using these patterns effectively.

The question of how reliable bearish candlestick patterns are is a valid one. No technical signal works 100% of the time. However, when used properly and in the right market conditions, these patterns can give traders an advantage. Their effectiveness increases when they align with other indicators, particularly in trending or overbought markets.
Bearish candlestick patterns tend to be more reliable in high-volume instruments and when they appear at natural turning points. In low-volume or illiquid markets, the signals may be more prone to noise. Historical testing and backtesting strategies show that while not perfect, bearish patterns are useful components of a disciplined Trading plan.
Despite their value, bearish candlestick patterns are not without flaws. They can give false signals, particularly in sideways or volatile markets. Traders may misread patterns without taking the broader trend or support levels into account. Some patterns also look similar to bullish formations, which can create confusion if not carefully analysed.
Moreover, these patterns are inherently backward-looking. They reflect what has already happened, not what will happen. As such, their predictive power should always be balanced with broader market context, including macroeconomic factors and upcoming news events.
What makes bearish candlestick patterns compelling is that they represent more than just data. They show how sentiment shifts over time. Whether it is buyers losing confidence, sellers regaining control, or uncertainty entering the market, these patterns tell a psychological story.
Traders who understand what bearish candlestick patterns reflect are better prepared to act when the mood changes. They use these insights not just to time exits, but to avoid entering trades based on emotion or late signals.
So, what are bearish candlestick patterns? They are visual indicators on a candlestick chart that suggest the potential for a price reversal to the downside. Found at the end of uptrends or near resistance levels, these patterns help traders anticipate when bullish momentum may be running out.
Patterns such as the bearish engulfing, shooting star, evening star, dark cloud cover, and hanging man all play a role in this analysis. Used properly, bearish candlestick patterns can be a valuable part of any technical trading strategy. They are not infallible, but when combined with sound risk management and broader market analysis, they offer useful signals in an ever-changing market environment.
Disclaimer: This material is for general information purposes only and is not intended as (and should not be considered to be) financial, investment or other advice on which reliance should be placed. No opinion given in the material constitutes a recommendation by EBC or the author that any particular investment, security, transaction or investment strategy is suitable for any specific person.