The Relative Strength Index (RSI) is a widely used and reliable technical indicator utilised by traders in various financial markets, including stocks, forex, commodities, and cryptocurrencies.
Developed by J. Welles Wilder in the late 1970s, RSI helps traders determine overbought or oversold conditions, spot potential reversals, and identify trends.
This guide will explain RSI, its calculation, crucial RSI levels that indicate buying or selling, divergences, failures, advanced strategies, real-world examples of RSI signals in charts, and how to integrate RSI with other tools for confirmation.
What Is the Relative Strength Index (RSI)?

The Relative Strength Index is a momentum oscillator that measures the speed and change of price movements over a specified period, usually 14 periods. The RSI value ranges between 0 and 100.
RSI Formula:
Although the mathematics behind it may seem complex, modern trading platforms like EBC Financial Group automatically calculate the RSI and plot it beneath price charts, making it easy for traders to interpret and take action.
Basic RSI Interpretation
Traders primarily use RSI to determine whether an asset is:
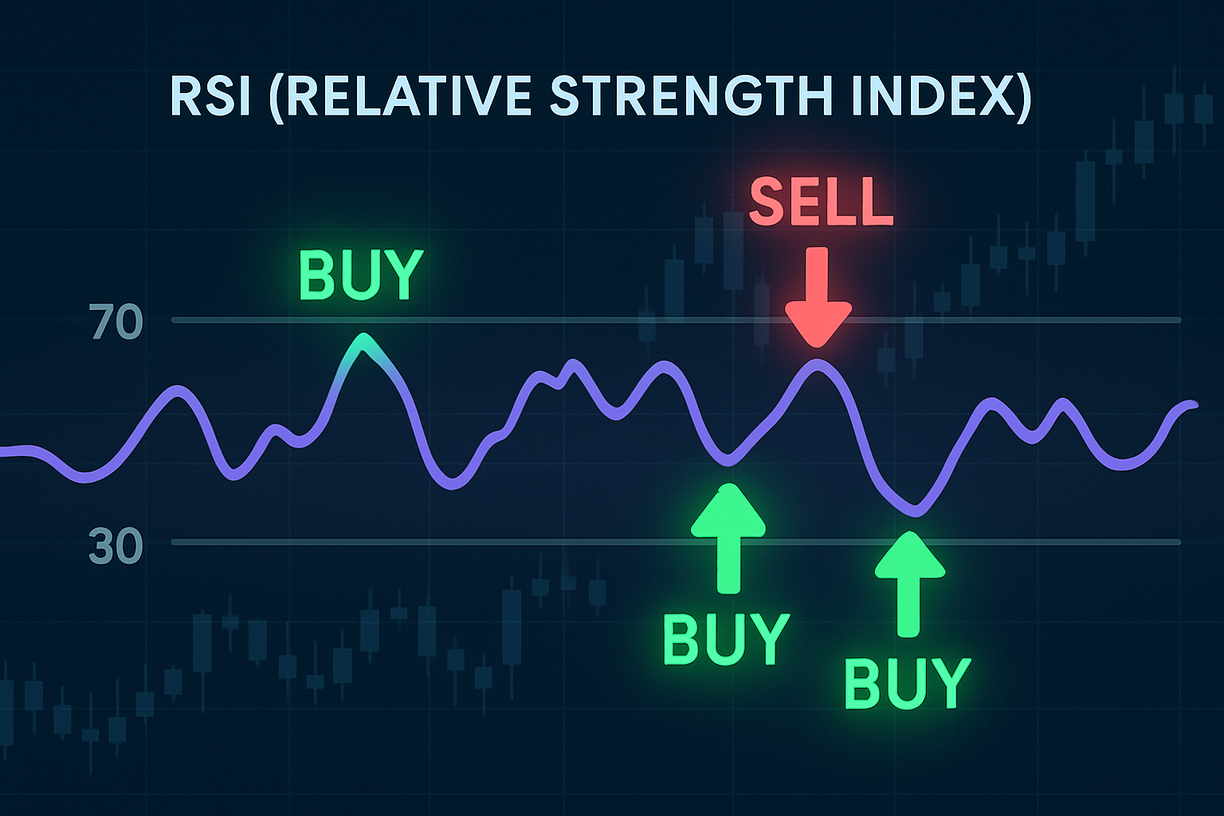
Overbought: RSI above 70, potentially signalling a sell
Oversold: RSI below 30, potentially signalling a buy
These thresholds indicate that the price may have moved too far, too fast, and a reversal or pullback could be near.
Key Levels:
Let's now explore the specific RSI buy and sell signals that can help you trade more effectively.
Top RSI Indicator Buy Signals

1. RSI Crosses Above 30 (Oversold Reversal Signal)
One of the most basic buy signals occurs when the RSI falls below 30 and then rises back above it. It suggests the bearish momentum is weakening, and a bullish reversal could follow.
Example:
In a downtrend, a stock's RSI drops to 25 and then rises back above 30. This may be a good time to consider entering a long position, especially if supported by a bullish candlestick pattern or volume spike.
2. Bullish Divergence
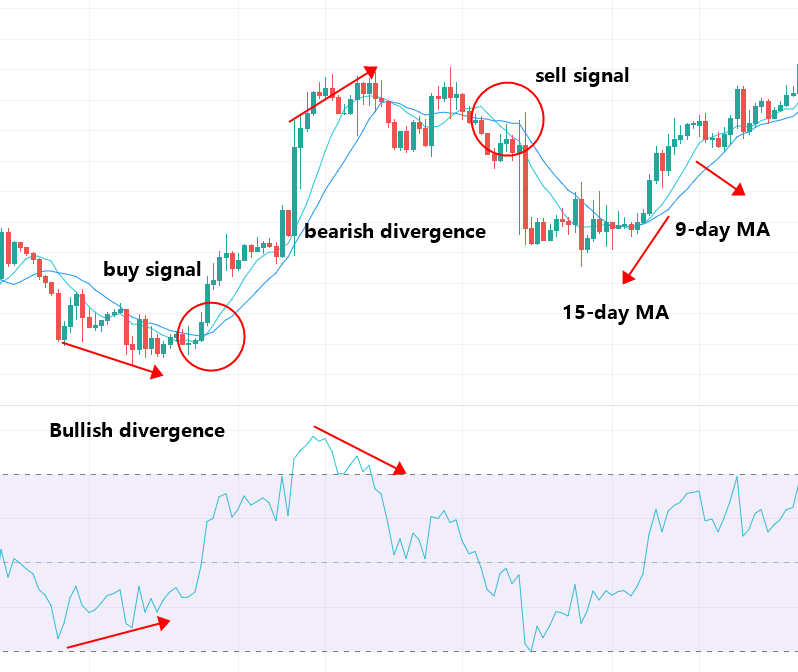
A bullish divergence occurs when the price hits a new low, but the RSI shows a higher low. This discrepancy suggests that selling pressure is decreasing, despite the price continuing to fall, indicating a potential reversal to the upside.
Key Insight:
Divergences work best near support zones or key moving averages. It is even more significant when RSI divergence occurs on higher time frames, such as daily or weekly charts.
3. RSI Breaks Above 50 (Trend Confirmation)
While levels 30 and 70 receive the most attention, the 50 level is also critical. When the RSI moves above 50, it indicates that bulls are gaining control. This information can confirm trend reversals or breakouts.
Practical Use:
When a price breaches resistance and the indicator moves above 50 from below, it indicates momentum is in line with price movement.
4. RSI Bounce from 40–50 During Uptrend
In strong uptrends, RSI often pulls back to the 40–50 zone and then bounces, acting as dynamic support. Buying during these bounces can be a high-probability strategy when the overall trend remains bullish.
5. Failure Swing (Bullish)
A bullish failure swing occurs when RSI:
Falls below 30 (oversold)
Rises above 30
Pulls back slightly (but not below 30 again)
Then pushes above its prior high
This four-step movement forms a pattern that signals strong bullish momentum and often precedes a price rally.
Top RSI Sell Signals to Watch

1. RSI Crosses Below 70 (Overbought Reversal Signal)
When the RSI moves above 70, the asset may be overbought. If it then drops back below 70, it's often interpreted as a signal to sell or take profits, especially in a ranging market.
Note:
Overbought doesn't always mean "short immediately." In strong uptrends, RSI can stay above 70 for extended periods. Always combine signals with price action.
2. Bearish Divergence
A bearish divergence forms when price makes a new high, but RSI forms a lower high. It indicates weakening momentum, suggesting the rally could be losing steam.
Use With Caution:
Look for divergence near resistance zones or after long rallies. Confirm with candlestick patterns such as shooting stars or bearish engulfing.
3. RSI Falls Below 50 (Bearish Momentum)
A move below 50 signals that bears have gained control of momentum. It can be a signal to exit long positions or even initiate shorts, especially in downtrending markets.
4. RSI Bounce from 50–60 During Downtrend
In a bearish market, RSI frequently bounces off 50–60 and continues to decline. Traders can use this zone as resistance for trend continuation trades.
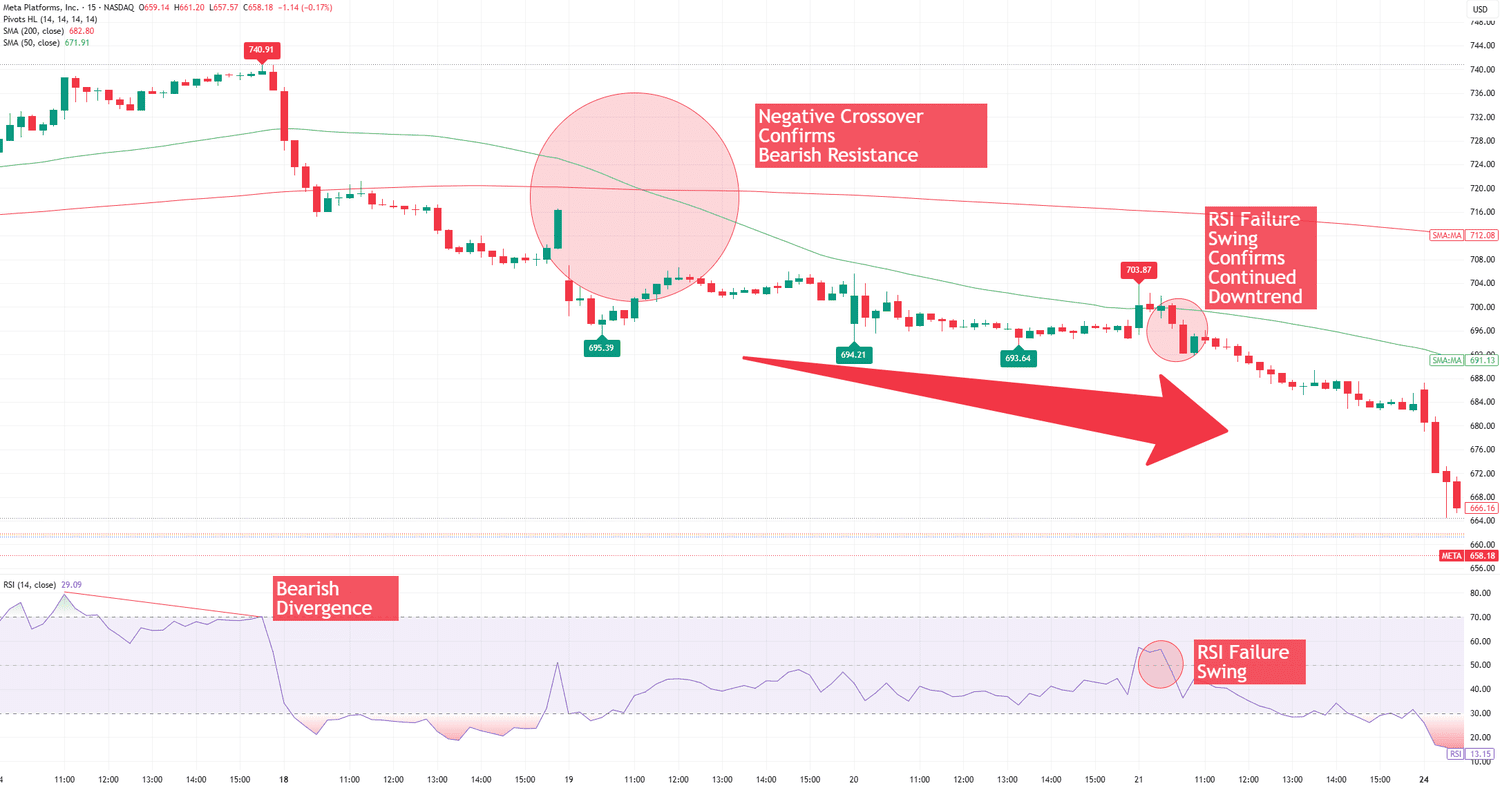
5. Failure Swing (Bearish)
A bearish failure swing happens when RSI:
Rises above 70 (overbought)
Falls below 70
Rises again (but not surpassing 70)
Then breaks below its prior low
It suggests a momentum breakdown and can foreshadow deeper declines.
Examples of RSI Indicator Buy and Sell Signals
Example 1: Bullish Divergence on USD/CHF (4H)
Result: Price rallied 200+ pips
Example 2: Bearish Failure Swing on Apple (AAPL Daily)
RSI rose above 70 and failed to hold
Formed a lower high and broke the prior RSI low
Price dropped over 8% in the following sessions
How to Use RSI in Different Markets

Forex Trading
RSI is widely used in forex markets, particularly in:
Range-bound conditions: Ideal for mean-reversion setups
Trend pullbacks: Identify buying opportunities in bullish pairs like USD/JPY, GBP/USD
Traders often use RSI settings of 14, 9, or 7 for intraday charts. Lower settings make RSI more sensitive but may increase noise.
Stock Trading
In equities, RSI works well during earnings seasons or technical breakouts. Watch for divergence near gaps or earnings rallies to signal exhaustion.
Crypto Trading
Given crypto's high volatility, RSI frequently reaches extreme levels. Traders look for RSI divergence to time Bitcoin or altcoin reversals.
Best RSI Settings for Different Trading Styles
| Trading Style |
Recommended RSI Period |
Why |
| Scalping |
5–7 |
Quick signals, high sensitivity |
| Intraday Trading |
9–14 |
Balance between speed and reliability |
| Swing Trading |
14 |
Default, widely accepted setting |
| Position Trading |
14–21 |
Filters short-term noise |
Always test and adjust based on asset volatility and your strategy.
Conclusion
In conclusion, the Relative Strength Index is more than just a technical indicator; it's a versatile tool that helps traders make informed decisions based on market momentum.
For traders at any skill level, understanding RSI buy and sell signals can improve entry and exit points with increased consistency. Combined with risk management and other tools, it becomes a powerful ally in your trading arsenal.
Disclaimer: This material is for general information purposes only and is not intended as (and should not be considered to be) financial, investment or other advice on which reliance should be placed. No opinion given in the material constitutes a recommendation by EBC or the author that any particular investment, security, transaction or investment strategy is suitable for any specific person.


