Published on: 2025-07-23

Reversal patterns are among the most widely tracked signals in technical analysis—and for good reason. They give traders the opportunity to capitalise on exhausted trends and early directional shifts across multiple timeframes. But knowing what these patterns look like is not enough; real trading edge comes from recognising the context, confirming validity, and executing with precision.

The Head and Shoulders (H&S) pattern is one of the most reliable reversal structures in technical trading. It typically forms after a prolonged uptrend and signals a shift from bullish to bearish sentiment. Its inverse counterpart points to a shift from bearish to bullish bias.
Structure & Characteristics:
Left shoulder: Price rallies to a high and then pulls back.
Head: Price makes a higher high, followed by another pullback.
Right shoulder: Price forms a lower high, completing the formation.
Neckline: A horizontal or slightly sloped trendline connecting the two troughs.
The pattern confirms once the price breaks below (or above, in the inverse version) the neckline.
Key Trading Notes:
Entry: Wait for a confirmed break and close beyond the neckline, preferably on increased volume.
Stop-loss: Above (or below) the right shoulder, depending on the pattern’s direction.
Target: Measured move—distance from the head to the neckline, projected from the breakout point.
Application Tip:
The best H&S patterns occur at key psychological levels (e.g., resistance zones, round numbers) and are accompanied by momentum divergence.

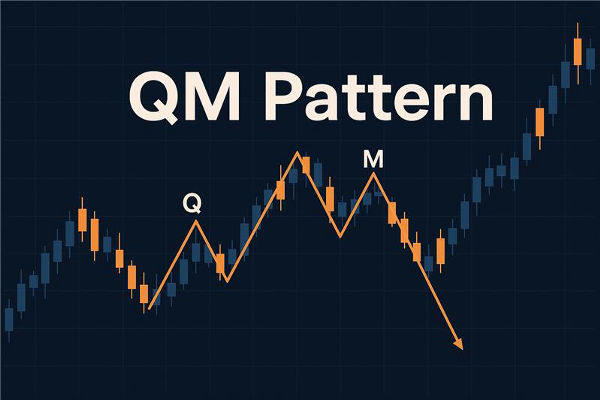
These classic "M" and "W" shaped patterns signify a failure of price to break through support or resistance and are often early warnings of a reversal.
Structure & Characteristics:
Double Top: Two peaks at approximately the same level with a trough in between.
Double Bottom: Two troughs at similar levels with a peak in between.
Neckline: Line drawn at the middle trough or peak (support/resistance level).
The pattern triggers upon a decisive break of the neckline.
Key Trading Notes:
Entry: On breakout retest or immediate post-breakout candle with strong momentum.
Stop-loss: Above the double top peaks (or below the troughs in the double bottom).
Target: Height of the pattern added (or subtracted) from the neckline breakout point.
Application Tip:
Avoid trading these patterns in strong, well-established trends. The most reliable setups occur after trend exhaustion or high-volume rejection wicks.

Wedge patterns are defined by converging trendlines that slope either upwards or downwards. They signal a gradual loss of momentum, often leading to a sharp reversal.
Types:
Rising Wedge: Bearish reversal following an uptrend. Trendlines slope upward and converge.
Falling Wedge: Bullish reversal following a downtrend. Trendlines slope downward and converge.
Key Trading Notes:
Entry: Upon breakout of the lower (rising) or upper (falling) trendline, ideally with a volume spike.
Stop-loss: Just outside the pattern boundary on the opposite side of the breakout.
Target: Measured from the widest part of the wedge projected from the breakout point.
Application Tip:
Watch for wedge formations during overextended moves and periods of low volatility. These are often precursor patterns to trend reversals or breakouts.
 Diamond patterns are rarer but highly potent reversal structures. They tend to appear at market tops (Diamond Top) or bottoms (Diamond Bottom) and reflect broad indecision before a directional change.
Structure:
Begins as a broadening formation (widening price range), followed by a contracting range, forming a diamond-like shape.
Typically forms after a significant trend, signalling a shift in control between buyers and sellers.
Key Trading Notes:
Entry: On breakout beyond the pattern boundary.
Stop-loss: Just outside the opposite boundary of the breakout.
Target: Height of the diamond projected in the breakout direction.
Application Tip:
Volume is crucial. A decline in volume during the formation and a surge during the breakout enhances pattern reliability. Diamond formations are more common on higher timeframes (e.g., 4H, daily).
 & Sushi-Roll Reversals") These are more advanced, less textbook patterns, favoured by momentum and breakout traders for their early signals and compact risk.
These are more advanced, less textbook patterns, favoured by momentum and breakout traders for their early signals and compact risk.
Volatility Contraction Pattern (VCP):
Created by Mark Minervini, the VCP features a series of successively smaller price swings, with volume contracting alongside.
Suggests that sellers are being absorbed, and the instrument is preparing for an explosive move.
Sushi-Roll Reversal:
Invented by Mark Fisher, this is a 10-bar pattern composed of a narrow trading range that occurs within a broader prior range.
Signals a reversal when a breakout occurs from the compact range in the opposite direction of the prior trend.
Key Trading Notes:
Entry: Breakout of the final tight range with increasing volume.
Stop-loss: Just below the range or final contraction.
Target: Use recent swing highs/lows or project based on ATR multiples.
Application Tip:
Best used on liquid instruments (stocks, ETFs, futures). Combine with volume and momentum indicators for added conviction.
Reversal patterns give traders the chance to enter trades early in a new trend. However, patience and discipline are essential: wait for confirmation, use proper risk management, and understand the context in which a pattern appears. Not all reversals succeed—some fake out and trap traders.
When used alongside volume analysis, market structure, and key levels, the five patterns covered above—Head and Shoulders, Double Tops/Bottoms, Wedges, Diamonds, and VCP/Sushi-Rolls—can offer powerful signals for tactical entries and exits.
For professional traders, these patterns are tools, not guarantees. The edge lies in execution, adaptability, and knowing when not to trade.
Disclaimer: This material is for general information purposes only and is not intended as (and should not be considered to be) financial, investment or other advice on which reliance should be placed. No opinion given in the material constitutes a recommendation by EBC or the author that any particular investment, security, transaction or investment strategy is suitable for any specific person.