Gold has long held a unique place in the global financial system. It functions as a store of value, a hedge against inflation, and a symbol of wealth across civilizations.
In modern markets, gold remains a key asset for investors, central banks, and portfolio allocators. One metric that often sparks debate is its market capitalization.
Though “market cap” is familiar in equity markets, applying it to gold offers a compelling lens on global wealth. In this article, we will explore what gold’s market cap means in 2025, how it’s calculated, and what it reveals about global finance.
Gold Market Cap Explained
What Does “Market Cap of Gold” Mean? When people refer to the gold market cap, they mean the total value of all above-ground gold, priced at current market rates. It’s an aggregate valuation, not tied to a single company or issuer. In other words:
This metric helps show how large gold’s “asset footprint” is relative to other asset classes, though with caveats.
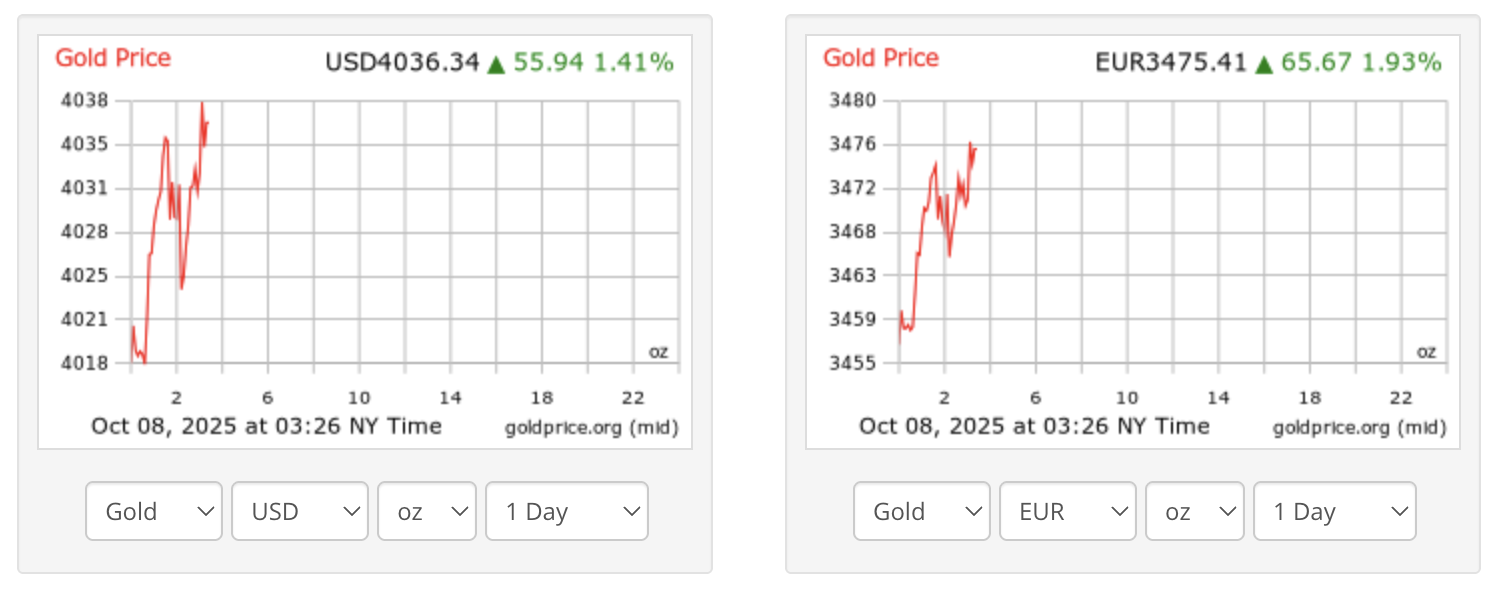 As of 2025, gold has surged to roughly $4,000 per ounce, as investors respond to inflation pressures, central bank buying sprees, and uncertain geopolitical conditions.
Which means:
That means the market cap of gold in 2025 stands near $27.8 trillion, making it one of the most valuable assets on Earth.
Historical Trends in Total Value
Gold’s total value has expanded dramatically over the decades. In the early 2000s, when gold traded below $400 per ounce, its total market capitalization was well under $2 trillion. By the early 2020s, with prices surpassing $2,000 per ounce, it had exceeded $10 trillion.
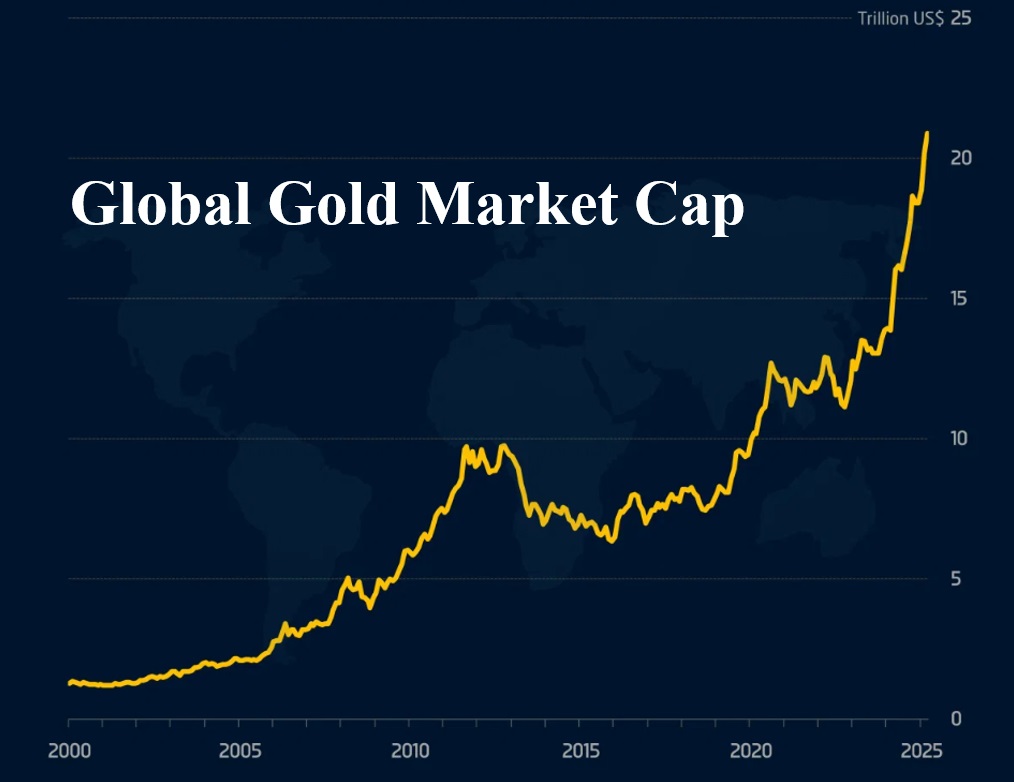
Now, in 2025, with gold near record highs, its market capitalization is over $27 trillion, reflecting a powerful long-term trend:
Limited new supply: Annual gold production adds only about 1.5–2% to total stock, meaning scarcity supports value.
Price-driven expansion: Most of gold’s market cap growth comes from rising prices, not increased output.
Macro resilience: Periods of economic uncertainty, currency depreciation, and debt expansion tend to boost gold demand, and with it, market value.
The steady rise in gold’s total capitalization underscores its enduring appeal as a reserve asset and inflation hedge in an era of financial volatility.
How Is Gold Price Calculated? (2025 Edition)
To estimate gold’s market cap, two primary variables are used:
-
Total Above-Ground Gold Stock
According to the World Gold Council, the cumulative amount of gold mined throughout history that still exists in some form is approximately 216,265 metric tonnes. This equals about 6.95 billion troy ounces.
Spot Price of Gold (2025)
As of 2025, gold is trading around $4,000 per ounce, driven by a combination of high inflation, central bank accumulation, and persistent geopolitical uncertainty.
To recap the formula:
However, estimates can vary depending on different data inputs. Some analysts use slightly lower above-ground totals or different spot prices, placing the gold market capitalization range between $20 trillion and $25 trillion.
Global Estimates & Variations
While the method seems straightforward, different sources present slightly varied estimates due to differences in:
Total supply assumptions – Some use more conservative or aggressive figures for above-ground gold.
Spot price inputs – Estimates often vary depending on the time of assessment and the currency used.
Measurement units – Some reports use tonnes, others use ounces or grams, which can affect perceived values if not standardised.
Additionally, some sources include tokenised gold, exchange-traded products, or unallocated gold holdings in broader calculations, which may inflate the perceived size of the market.
Comparing Gold’s Market Cap to Other Assets
To appreciate its scale, consider how gold stacks up against other major assets:
| Asset Class |
Estimated Market Cap (2025) |
| Gold |
$27.8 trillion |
| Global Equities |
~$110 trillion |
| Global Bonds |
~$130 trillion |
| Bitcoin |
~$2.43 trillion |
| Silver |
~$1.2 trillion |
While gold’s market cap is smaller than global stocks or bonds, it remains enormous relative to individual asset classes. Its stability and scarcity make it a cornerstone of central bank reserves and a trusted hedge for institutional investors.
Limitations of Using Market Cap for Gold
While gold’s market cap is a useful macro indicator, it has its limits:
Not all gold is tradable.
A large portion is held in jewelry, private collections, or central bank vaults, not circulating in markets.
No issuing entity.
Unlike stocks or crypto, gold isn’t “issued.” Its market cap doesn’t imply profitability, dividends, or innovation potential.
Overlapping calculations.
Some estimates double-count paper and physical gold, exaggerating real liquidity.
Currency distortion.
Since gold is priced in USD, currency fluctuations can skew the perceived value in other currencies like GBP, EUR, or JPY.
So, while the gold market cap measures total global value, it doesn’t necessarily reflect active trading volume or accessibility.
Despite these challenges, gold market cap remains a widely cited figure in financial media and macroeconomic research, especially when comparing it to cryptocurrencies like Bitcoin, which are often referred to as "digital gold".
Why Gold’s Market Capitalization Matters in 2025

In 2025, gold’s market cap tells a broader story about global finance:
Monetary confidence: The rise in gold’s total value often signals waning trust in fiat currencies and inflationary policies.
Institutional demand: Central banks, particularly in Asia and the Middle East, continue to accumulate gold as a diversification hedge.
Digital comparisons: Bitcoin is frequently dubbed “digital gold,” but with a market cap nearly 20 times smaller, gold remains the definitive benchmark for hard assets.
Global wealth benchmark: At over $27 trillion, gold represents roughly 10% of global household wealth, cementing its role as a foundational asset class.
Thus, tracking gold’s market capitalization isn’t just about numbers. It’s about measuring global economic sentiment.
Frequently Asked Questions (FAQs)
1.What is the total market cap of gold in 2025?
As of early 2025, the gold market cap is estimated at around $27.8 trillion USD, based on total above-ground gold (≈ 216,265 tonnes) multiplied by a spot price near $4,000 per ounce.
2.How do you calculate the market cap of gold?
You multiply the total above-ground gold (in ounces) by the current spot price per ounce. This gives a rough estimate of gold’s overall value, though variations in supply, pricing, and methodology can change the result.
3.Why does gold’s market capitalization matter to investors?
Gold’s market capitalization offers a macro view of its role in global wealth. It signals monetary confidence, helps compare gold to other asset classes, and offers insight into demand, inflation hedging, and reserve asset strategies.
4.How does gold’s market cap compare to Bitcoin in 2025?
In 2025, gold’s market capitalization (~$27 trillion) is vastly larger than Bitcoin’s (around ~$2.43 trillion). This reflects gold’s deeper institutional, reserve, and historical roles, reinforcing its position as the benchmark for hard assets.
Final Thoughts
The gold market capitalization in 2025, estimated at over $27 trillion, captures more than the metal’s price; it reflects the pulse of global wealth and investor sentiment. As inflation, geopolitical risk, and digital assets reshape markets, gold’s steady rise in market cap demonstrates its resilience as both a monetary anchor and a wealth store.
As long as gold retains its status as a global reserve and inflation hedge, tracking its market capitalization will remain a valuable lens through which to measure both confidence in fiat systems and the evolving structure of global wealth.
Disclaimer: This material is for general information purposes only and is not intended as (and should not be considered to be) financial, investment or other advice on which reliance should be placed. No opinion given in the material constitutes a recommendation by EBC or the author that any particular investment, security, transaction or investment strategy is suitable for any specific person.


 As of 2025, gold has surged to roughly $4,000 per ounce, as investors respond to inflation pressures, central bank buying sprees, and uncertain geopolitical conditions.


