Technical analysis in the stock market offers traders a variety of tools to understand price movement and spot trading opportunities. Among these tools, moving averages are one of the most commonly used indicators.
However, a special variant called the Displaced Moving Average (DMA) gives traders a unique edge by offering a forward-looking view of price trends.
In this article, we will explore what DMA is, how it works, the pros and risks associated with it, and several strategies to apply it effectively in trading.
What Is DMA (Displaced Moving Average) in the Stock Market?
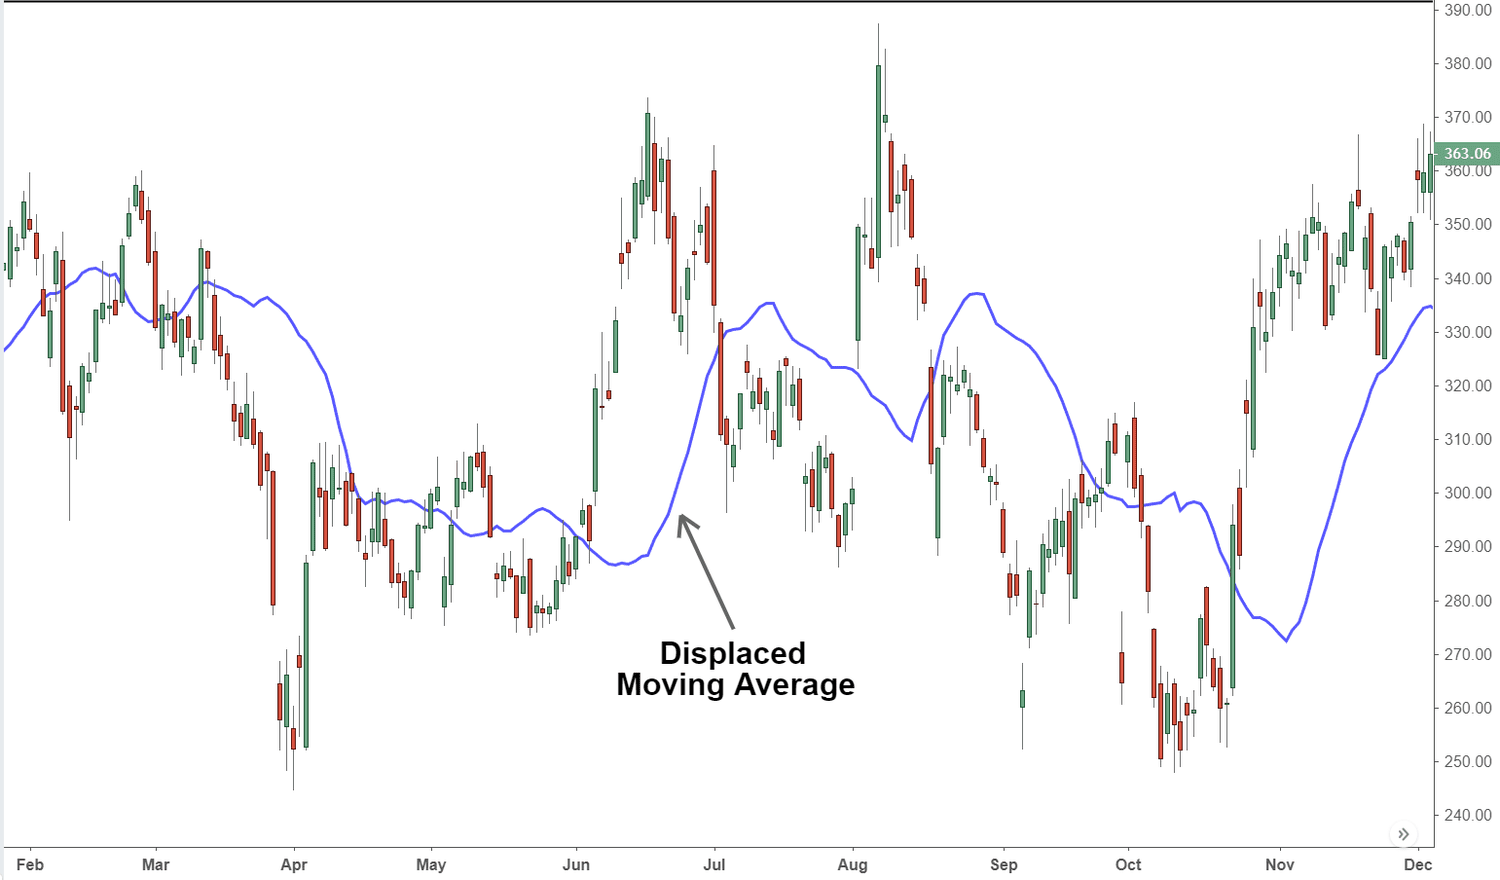
A Displaced Moving Average (DMA) is a simple or exponential moving average that is shifted forward or backwards on the chart by a specified number of periods. The idea is to "displace" or move the moving average so it aligns more closely with future price action, offering a smoother and often more visually useful representation of market trends.
If a trader uses a 20-day moving average and displaces it forward by 5 days, the line is plotted 5 days ahead of where it would usually appear. This displacement makes trend identification slightly more predictive, offering a more strategic perspective on price momentum.
DMA can be applied to any moving average — simple (SMA) or exponential (EMA) — depending on the trader's preference. The displacement moves the line horizontally on the graph without altering its calculation.
How to Calculate DMA
The calculation of the displaced moving average involves two steps. First, you calculate a standard moving average, either SMA or EMA, using your desired number of periods. Then, you shift the plotted line forward or backwards on the price chart.
For example:
This visual shift alters how the trader interprets price trends, without changing the core data.
How to Interpret DMA on a Price Chart
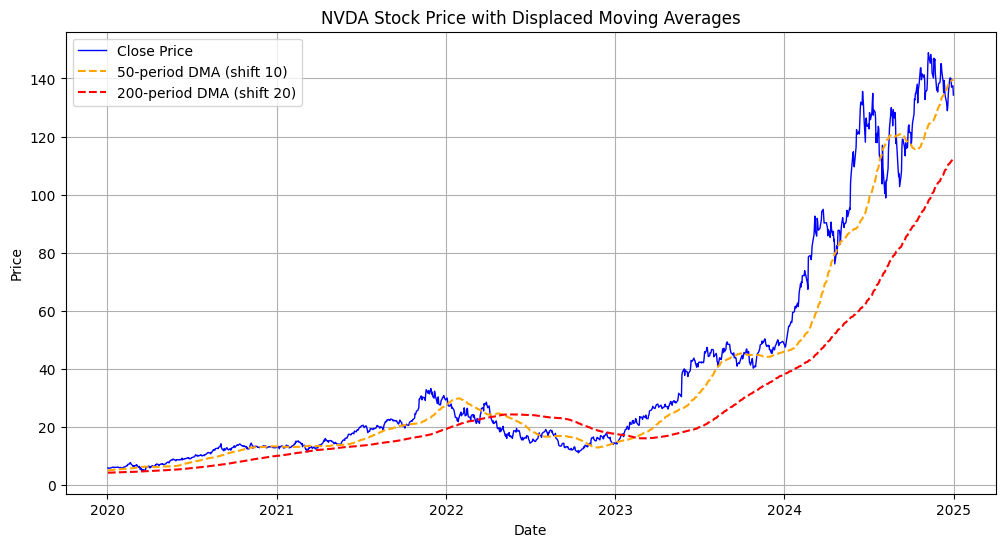
On a typical chart, a positively displaced moving average (e.g., +5) will appear to the right of the actual price, seemingly forecasting the path. This displacement can provide support and resistance levels and help define entry or exit points based on crossover behaviour or price interaction.
When the price crosses above the displaced moving average, it can signal bullish momentum. Conversely, a price drop below the DMA may indicate bearish momentum. However, since the DMA is shifted forward, it provides these signals slightly earlier than traditional moving averages.
Some traders also use multiple DMAs on the same chart — such as a 20 DMA and a 50 DMA — to create crossover systems for buying or selling, just like they would with traditional MAs.
Why Use DMA Instead of Regular Moving Averages?
Standard moving averages are lagging indicators. They are effective in confirming trends, but by the time they signal a move, much of the opportunity may already have passed. A displaced moving average attempts to resolve this by visually leading price action, allowing traders to anticipate shifts earlier.
DMA adds an extra layer of timing by aligning the moving average closer to current or future price action. It can be effective in momentum trading, trend-following systems, and intraday scalping, where timing is critical.
By advancing the moving average, DMA can also help filter out minor price noise and whipsaws that can confuse when using standard moving averages.
DMA vs Traditional Moving Averages
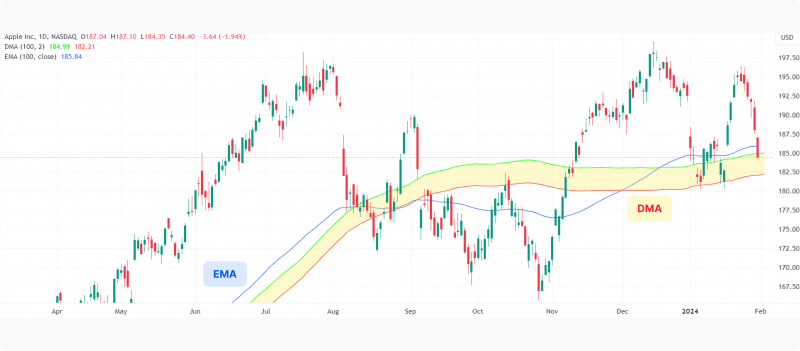
To understand DMA's value, let's compare it with traditional moving averages:
SMA/EMA offer lagging signals, confirming trends but with delayed entry points.
DMA provides a leading visual, helping traders anticipate and prepare for potential moves.
In volatile or fast-moving markets, this edge in timing can be critical. However, one must balance with validation to avoid acting on false breakouts.
DMA isn't a replacement for moving averages — it's a refinement. Many traders use both DMA and standard MAs together for additional perspective.
Popular DMA Trading Strategies
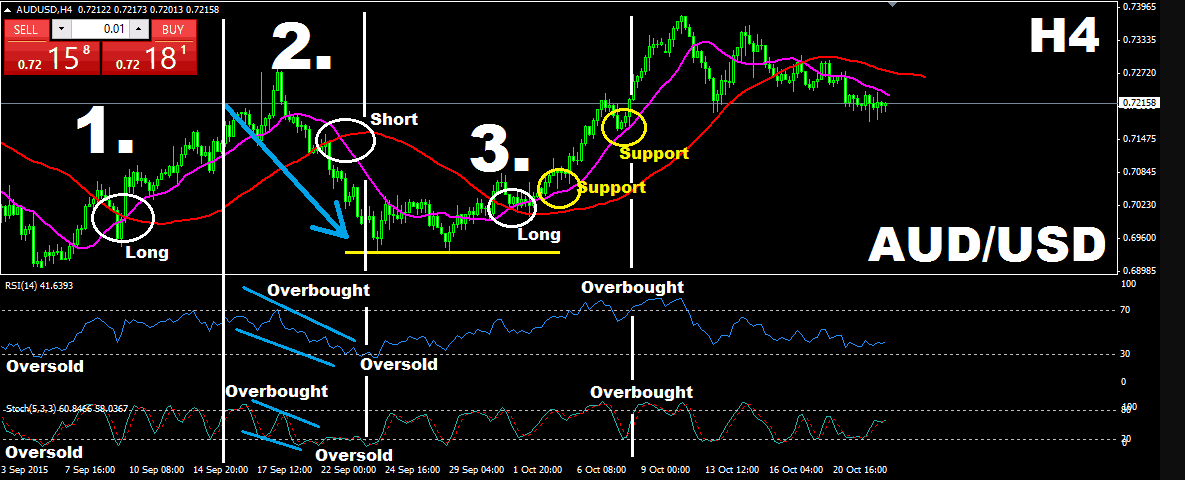
DMA Crossover Strategy
Similar to traditional moving average crossover systems, this strategy involves two displaced moving averages — one short-term and one long-term. A bullish signal occurs when the shorter DMA crosses above the longer DMA. A bearish signal appears when the reverse happens.
This setup helps identify trend changes early and can be applied across timeframes from 5-minute to daily charts.
DMA and Price Breakout Strategy
Traders use DMA as a dynamic support or resistance level. When the price breaks above the displaced average and retests it successfully, it may signal a breakout and trend continuation.
In this method, the DMA acts as a visual guide for stop-loss placement and trade confirmation.
Combining DMA with RSI or MACD
To reduce false signals, DMA can be paired with momentum indicators like RSI or MACD. For example, if the price crosses above a 20-period +5 DMA and the RSI crosses above 50, this confluence increases the probability of a bullish move.
Such combinations make DMA more reliable by confirming signals with independent indicators.
Scalping with DMA on Lower Timeframes
On 1-minute or 5-minute charts, intraday scalpers can use very short-term DMAs (e.g., 9-period DMA displaced by 3) to ride quick momentum bursts. Entry and exit are triggered based on price and DMA interactions, often filtered through volume or volatility indicators.
This approach requires strict risk management due to the speed of execution and potential for rapid reversals.
Pros of Using DMA in Trading
Leads price action visually, helping traders anticipate market direction earlier than traditional moving averages.
Reduces lag commonly associated with standard moving averages like SMA or EMA.
Improves timing of entries and exits, particularly in trending markets.
Acts as dynamic support or resistance, offering traders more precise trade setups.
Customisable settings for period length and displacement to fit any trading style or timeframe.
Smooths out market noise, making it easier to identify the dominant trend.
Versatile application, suitable for day trading, swing trading, and scalping strategies.
Risks and Limitations of DMA
Higher risk of false signals, especially in sideways or highly volatile markets.
Can lead to premature entries, as traders may act before full confirmation of the trend.
No insight into fundamentals, since it's purely a technical tool.
May create psychological bias, where the trader overly relies on the displaced line.
Over-optimisation risk, especially when backtesting with curve-fitted DMA parameters.
Not suitable as a standalone indicator, and should be confirmed with other tools like RSI, MACD, or volume.
Is Applying DMA in the Stock Market Suitable for You?
DMA is best suited for:
Trend-following traders are looking to enter early.
Swing traders need visual confirmation of momentum.
Scalpers who need to make time entries on short bursts.
Traders combine indicators to increase signal strength.
It is less suitable for fundamental investors or those focused on dividend income, as it adds little value outside of a price-based strategy.
Conclusion
In conclusion, the Displaced Moving Average (DMA) is a powerful yet underused tool in the trader's arsenal. By visually leading price action, it gives traders an anticipatory view of trends and momentum shifts. It's effective in fast-moving markets or strategies that rely on early entries and exits.
While DMA comes with certain risks, including false signals and psychological bias, these can be mitigated by combining it with volume, RSI, or price action patterns. DMA should be seen as an enhancement, not a replacement, for traditional moving averages.
Disclaimer: This material is for general information purposes only and is not intended as (and should not be considered to be) financial, investment or other advice on which reliance should be placed. No opinion given in the material constitutes a recommendation by EBC or the author that any particular investment, security, transaction or investment strategy is suitable for any specific person.


