Published on: 2025-07-15

Candlestick patterns have long been at the heart of technical analysis, offering visual clues to market sentiment and potential trend reversals.
Among the most recognised bullish reversal signals is the Green Hammer Candlestick. While simple in appearance, this pattern can signal powerful opportunities when understood and used effectively.
In this article, we'll explore what the green hammer candlestick pattern is, how to identify it, its pros and cons, and real-world examples that demonstrate how traders can benefit from this formation.

The green hammer candlestick is a single-bar bullish reversal pattern that forms at the bottom of a downtrend. Visually, it features a small body near the top of the candle and a long lower shadow.
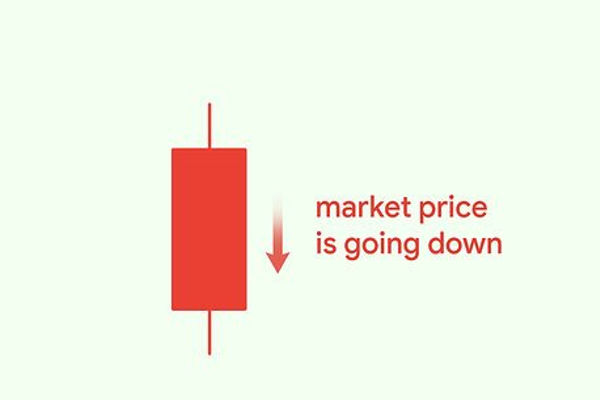
The green colour indicates that the closing price was higher than the opening price during that trading session, reflecting buying pressure after early selling.
This formation gets its name because it resembles a hammer: the "handle" being the small body at the top and the "head" being the long wick below. It signifies a shift in momentum where sellers dominated initially, but buyers regained control by the end of the session.

A proper green hammer candlestick has several key characteristics:
It appears after a downtrend, often signalling a potential bullish reversal.
The candle has a small green body near the top of the range.
The lower shadow (wick) is at least two to three times longer than the body.
There is little or no upper shadow.
Although green hammers can occur in any time frame—daily, hourly, or even minute charts—they are more reliable on longer time frames where they indicate stronger market sentiment changes.
The green hammer pattern appears in various financial markets. In forex, it might form after a pair like USD/JPY undergoes a sharp sell-off, signalling a potential bounce. In commodities, you might see it in gold or oil charts when prices decline rapidly, then bounce intraday.
In stocks, green hammers are common around earnings season or after negative headlines. If a stock overreacts to bad news and recovers, a green hammer may form and indicate a reversal.
Each market has its unique volatility and behaviour, but the principles of green hammer interpretation remain consistent across asset classes.

Both green and red hammer candlesticks are considered bullish reversal signals, but the green hammer is generally seen as slightly more bullish. That's because a green candle indicates the price closed higher than it opened, showing clear buyer dominance by session end.
In contrast, a red hammer closes below the open despite the long lower shadow, suggesting weaker bullish conviction.
While both are valid, traders often favour the green hammer in making long-term trade decisions, particularly when supported by confirmation on subsequent candles.

Trading the green hammer involves identifying the pattern correctly and confirming it with subsequent price action. A typical approach includes:
Identifying a green hammer after a downtrend.
Waiting for a confirmation candle (a bullish candle closing above the hammer).
Entering a long position once the confirmation is complete.
Setting a stop-loss slightly below the low of the green hammer to manage risk.
Targeting a predefined resistance level or using risk-reward ratios to exit.
Many traders use Fibonacci retracement levels, previous resistance zones, or moving averages to determine take-profit levels. Combining the green hammer with other indicators increases the odds of a successful trade.
Imagine Apple's stock is in a five-day downtrend due to macroeconomic concerns. On the sixth day, a green hammer appears on the daily chart with a long lower shadow and high volume. The following day, a strong bullish candle confirms the pattern by closing well above the hammer's high.
A savvy trader could enter a long position at the close of the confirmation candle and place a stop-loss below the green hammer's low. As price rallies back toward a recent resistance level, they exit the trade with a solid profit, all thanks to interpreting a single candlestick pattern within a suitable context.
One of the most common mistakes beginners make is assuming every green hammer will lead to an uptrend. In reality, not all green hammers produce bullish reversals.
Many traders also neglect the importance of confirmation. Jumping into a trade immediately after spotting a green hammer without waiting for follow-through buying can lead to false entries.
Another mistake is ignoring market context. Green hammers forming in sideways or already-upward trending markets offer little value. Always analyse the larger trend and structure before acting.
Therefore, volume plays a crucial role in confirming the green hammer's strength. For instance, when the green hammer accompanies high trading volume, it suggests that the reversal is supported by broader market participation. It increases the reliability of the signal.
Low volume hammers, on the other hand, may reflect short-term market noise or weak buyer interest, making them less trustworthy. Therefore, volume should always be a part of your green hammer analysis toolkit.
Additionally, the green hammer becomes more powerful when combined with other tools such as Relative Strength Index (RSI), Moving Averages (MA), Bollinger Bands, or trendlines.
For instance, if RSI shows the market is oversold and a green hammer forms at a key support zone, the probability of a successful trade increases. Similarly, if the hammer forms near the lower band of Bollinger Bands, it may signal a short-term reversal.
When multiple tools align with the green hammer, it reinforces the idea that market sentiment may be turning bullish, giving traders more confidence to execute.
| Pros | Cons |
|---|---|
| Easy to recognize visually, making it beginner-friendly | Can produce false signals if not confirmed by subsequent price action |
| Works across all timeframes and financial markets | Less reliable in sideways or ranging markets |
| Signals potential bullish reversal after a downtrend | Depends heavily on context for effectiveness |
| Offers tight stop-loss opportunities with favorable risk-reward setups | Single-candle pattern—offers less confirmation than multi-candle setups |
| Can be combined with other indicators like volume, RSI, or moving averages | May be misinterpreted without proper understanding of market structure |
In conclusion, the green hammer candlestick pattern is a visually simple yet powerful tool for identifying potential bullish reversals in downtrending markets. While no pattern is foolproof, this formation can be highly effective when used in conjunction with confirmation signals and broader technical analysis.
Success in trading comes not from relying on a single signal but from building a strategy that includes pattern recognition, risk management, and emotional discipline. The green hammer offers a compelling piece of that puzzle.
Disclaimer: This material is for general information purposes only and is not intended as (and should not be considered to be) financial, investment or other advice on which reliance should be placed. No opinion given in the material constitutes a recommendation by EBC or the author that any particular investment, security, transaction or investment strategy is suitable for any specific person.