Published on: 2025-04-15 Updated on: 2025-10-06

For traders, spotting volatility shifts early can mean the difference between catching a breakout or being caught off guard.
Volatility simply measures how much and how quickly the price of an asset moves. High volatility means prices can swing dramatically in a short time, while low volatility reflects calmer, more stable price movements.
The Chaikin Volatility indicator helps traders read these market shifts with more confidence. By combining both price range and trading volume, it offers insights beyond traditional price-only volatility tools.
In this guide, you’ll learn what Chaikin Volatility is, why it matters, and how you can use it to strengthen your trading strategy in 2025.
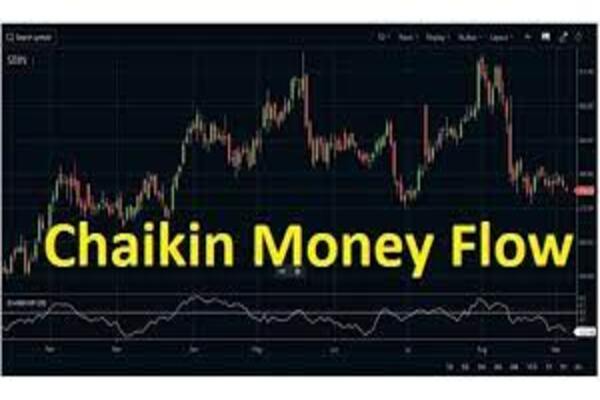
The Chaikin Volatility indicator, developed by Marc Chaikin, measures the rate of change in the spread between an asset’s high and low prices, adjusted by volume.
In simple terms:
When price ranges widen and volume rises, volatility is increasing.
When ranges tighten and volume drops, volatility is decreasing.

Typically, the indicator is calculated using a 10-day moving average of the difference between highs and lows, making it responsive to short- and medium-term market conditions.
Volatility is a double-edged sword. Too little, and markets stagnate. Too much, and price becomes erratic. The strength of Chaikin Volatility is that it helps you detect transitions:
Breakout signals: Sharp increases in volatility often precede major price moves.
Trend confirmation: Rising volatility during a trend suggests strength.
Consolidation detection: Falling volatility may indicate quiet phases or rangebound markets.
Risk management: Increased volatility can warn you to widen stops or be more cautious with position sizes.
By reading volatility shifts, traders gain an edge in timing entries and exits.
The Chaikin Volatility indicator can be used in a variety of ways to improve trading decisions such as:
When volatility spikes suddenly, it often signals that the market is preparing for a strong move. Traders can use this as an early entry point to capture momentum-driven swings.
During established trends, rising volatility shows strength. If volatility drops while the trend continues, it may indicate weakening momentum or consolidation.
High volatility increases potential risk. By monitoring the indicator, traders can adjust stop-loss levels and position sizes to protect against sharp price swings.
Traditional volatility indicators, like Average True Range (ATR) or Bollinger Bands, focus only on price movement. The Chaikin Volatility indicator adds volume to the calculation, making it more responsive and often providing earlier signals.
However, no indicator is foolproof. The best results come from combining Chaikin Volatility with other tools, such as momentum oscillators or trend lines, for a balanced trading view.
While the indicator offers powerful insights, traders should follow a few best practices to avoid common mistakes and refine their use of Chaikin Volatility.
Don’t use Chaikin Volatility in isolation: Always pair it with trend lines, momentum tools, or volume confirmation.
Be cautious in low-liquidity assets; volume-based indicators can mislead in markets with erratic volume spikes.
Adjust your settings based on timeframe and asset: Default periods (10, 10) work well for many, but may be too noisy or slow in fast-moving assets.
Test Chaikin Volatility on demo accounts before applying live: Indicators behave differently across assets.
Consider a trader using the Chaikin Volatility indicator on a stock that has been moving within a narrow range. If the Chaikin Volatility begins to rise, it suggests that the stock is experiencing increasing fluctuations and may be about to break out of its range. This is a signal to the trader that the stock might be primed for a larger move, providing an opportunity to enter a trade.

By using the data available on platforms, traders can optimise their entry points and better predict market movements.
To enhance your analysis, Chaikin Volatility can be used alongside other technical indicators. Combining it with tools like Relative Strength Index (RSI) or Moving Averages can give traders a clearer view of market conditions.
Chaikin Volatility is used to measure market volatility by analyzing price ranges and trading volume. Traders use it to spot breakout signals, confirm trends, and manage risk.
Rising Chaikin Volatility suggests increasing price swings and potential breakouts, while falling volatility indicates market consolidation or reduced momentum.
Chaikin Volatility is different from ATR because it includes volume in its calculation. This often makes it more responsive than ATR, but many traders use both together for stronger confirmation.
The default setting is a 10-period moving average, but traders adjust based on asset type and timeframe. Shorter settings capture quick moves, while longer ones smooth out noise.
Yes, beginners can use Chaikin Volatility as a simple way to track volatility shifts. However, it works best when combined with trend indicators and sound risk management.
The Chaikin Volatility indicator stands out by blending price range and volume, giving traders a sharper lens on market behavior. It helps anticipate breakouts, validate trends, and detect consolidations, but works best as part of a broader trading strategy.
For traders in 2025, tools like Chaikin Volatility are invaluable for navigating fast-changing markets with greater confidence and precision.
Disclaimer: This material is for general information purposes only and is not intended as (and should not be considered to be) financial, investment or other advice on which reliance should be placed. No opinion given in the material constitutes a recommendation by EBC or the author that any particular investment, security, transaction or investment strategy is suitable for any specific person.