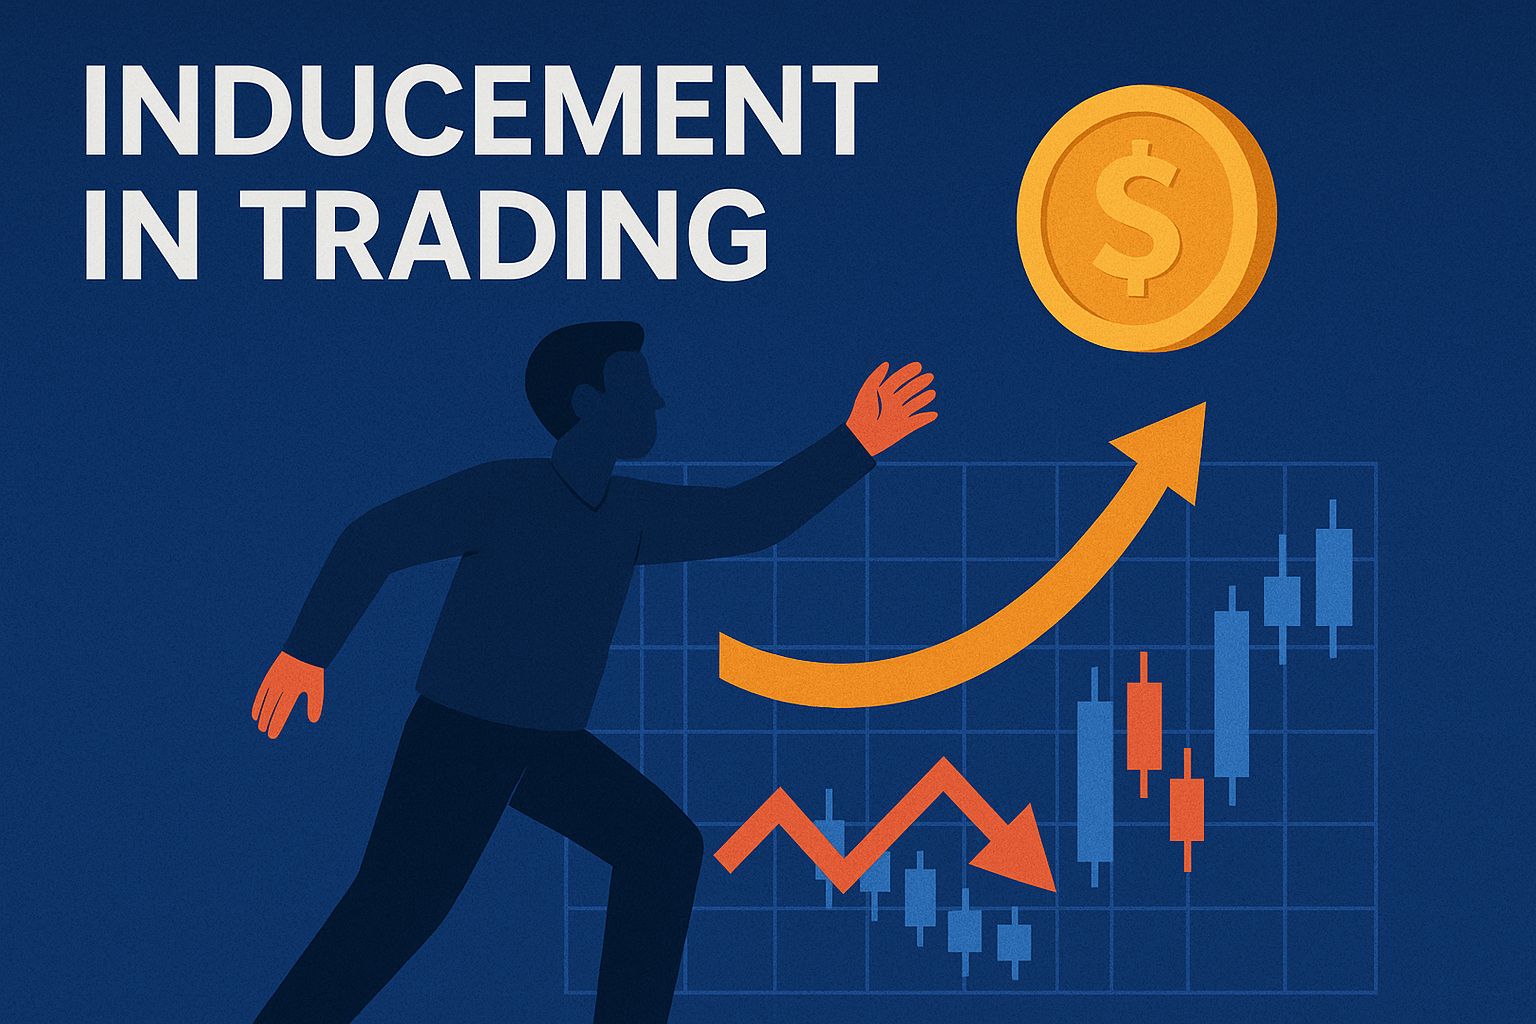
Financial markets resemble stage illusions. Apparent momentum is often misdirection. Traders spot a breakout, leap in, and quickly get trapped as the market reverses. This isn’t chaos; it’s inducement; a setup luring traders to the wrong side before the real move.
In 2025, algorithmic execution and institutional order flow pit retail traders against systems designed to exploit emotion and impatience. Inducement in trading is not a conspiracy but a structural feature. False breakouts occur because price requires liquidity. Recognising these traps early is critical for new traders. This article details five common inducement mistakes and practical corrections.

What Is Inducement in Trading?
Inducement in trading is market behavior that lures traders into early entries before a significant move. It is key in Smart Money Concepts (SMC), detailing how institutions move liquidity to fill orders efficiently.
Inducement occurs when price creates a tempting structure that convinces traders to enter early. Once they do, their stop-losses provide the liquidity institutions need to move in the opposite direction. After these stop orders are triggered, the true move begins with strong displacement.
A typical sequence looks like this:
Market forms a trend or key level.
Price creates a small breakout or retracement that attracts traders.
Liquidity accumulates above or below.
Institutions sweep that liquidity.
The real direction continues after the sweep.
Modern algorithmic systems constantly scan for these liquidity zones. In 2025, around 78 percent of all global trading volume is algorithmically executed (Refinitiv, 2025). Every automated order engine seeks the same objective: find liquidity, create inducement, and then move price efficiently.
How Traders Misread Inducement in Trading: The Five Classic Mistakes
Mistake 1: Confusing Inducement in Trading with Liquidity Grab
Many traders think inducement and liquidity grab mean the same thing, but they are two different phases of market structure. Inducement is the setup; liquidity grab is the result.
When traders mistake one for the other, they enter trades far too early. The inducement creates the illusion of a breakout, drawing in both retail buyers and sellers. Only when those orders are trapped does the real liquidity grab occur.
Real-Life Example: EUR/USD, April 2025
In early April 2025, EUR/USD rallied from 1.0860 to 1.0920 after dovish comments from the European Central Bank. Retail traders rushed in long, believing the euro had broken resistance. However, on 3 April, price briefly pushed above 1.0930, stalled, and reversed violently to 1.0875. The rally above 1.0920 was the inducement; the sweep of liquidity below it confirmed the trap.
Traders who mistook the inducement for a breakout lost momentum entries, while patient observers waited for displacement confirmation and profited from the 55-pip drop.
How to Correct It
Mark previous highs and lows where stop-losses accumulate.
Wait for displacement after a liquidity sweep before confirming bias.
Remember: inducement creates liquidity, liquidity grab consumes it.
Mistake 2: Ignoring Multi-Timeframe Context
Inducement never exists in isolation. A false breakout on a 15-minute chart might mean nothing if the 4-hour structure points in the opposite direction. Beginners often focus on small charts, spotting inducement everywhere, while ignoring that higher-timeframe flow governs the entire move.
Understanding Context
Price operates like nested structures. A 1-hour inducement could simply be part of a 4-hour retracement or a daily re-accumulation. Analysing inducement in trading without context leads to false assumptions.
Start by identifying the dominant trend on higher timeframes (daily or 4-hour). Then zoom into smaller charts to find inducement that aligns with the main direction. When higher-timeframe structure and inducement agree, probability rises sharply.
Case Study: GBP/USD, February 2025
GBP/USD consolidated around 1.2550 for several days. On a 15-minute chart, a small rally looked like inducement before a bullish move. Many traders went long. However, the 4-hour chart revealed that price was still in a broader bearish structure targeting 1.2450 support.
The supposed inducement was actually part of a larger continuation pattern. The pair later fell 100 pips. Only traders who aligned smaller-timeframe analysis with higher-timeframe direction avoided the trap.
How to Correct It
Always perform top-down analysis: daily → 4-hour → 1-hour → 15-minute.
Confirm inducement in premium or discount zones relative to overall trend.
Avoid judging inducement from one timeframe alone.
Mistake 3: Trading Inducement Too Early
One of the costliest mistakes is jumping into trades before inducement completes. Traders see a minor retracement or a pair of equal highs and assume it signals a reversal. But without the liquidity sweep and confirmation candle, the market often continues in the same direction.
Why Early Entries Fail
Inducement forms because institutions need traders to take positions that can be used as liquidity. Entering early means joining the wrong side of that process. The market then uses your position to generate the next move.
Data Insight
Backtests on major forex pairs between 2020 and 2024 show that trades entered before inducement confirmation had a success rate of about 37 percent, while those executed after a confirmed sweep and displacement had a success rate above 63 percent. Patience improves profitability far more than additional indicators.
Real-Life Example: NASDAQ 100, January 2025
During the first week of January 2025, NASDAQ futures showed repeated minor pullbacks from the 17,200 area. Traders assumed these shallow drops were inducement before another rally. Many entered early long positions. The market then made one more fake push to 17,280 before dropping to 16,900 within hours.
That final push was the true inducement; early buyers became liquidity. Traders who waited for displacement confirmation after the drop were able to ride the next rally that began two days later from 16,900 to 17,350.
How to Correct It
Wait for a clear sweep and rejection candle.
Combine structure with momentum tools like RSI or volume divergence.
Let the market prove its intent before committing.
Mistake 4: Ignoring Volume and Order Flow
Volume is the oxygen of inducement. Without real participation, there is no trap. Many traders look at price alone and forget that inducement is a liquidity event. Watching tick volume or order flow can confirm whether a move truly has participation behind it.
Why Volume Confirms Inducement
Inducement typically appears with sudden increases in volume near key levels. When volume spikes without follow-through, it suggests absorption, large players taking the opposite side of retail orders. That is a hallmark of inducement.
Real-Life Example: Bitcoin CFDs, June 2025
On 17 June 2025, Bitcoin hovered around 62,000 USD after several days of sideways action. Suddenly, volume surged 18 percent above its 20-day average as price spiked to 63,200, attracting breakout buyers. Within an hour, price reversed to 61,100. Order-flow data from EBC’s liquidity dashboard showed heavy sell absorption during the breakout candle.
The surge in participation with no continuation confirmed that the move was inducement, not trend initiation. Those who ignored volume were caught long at the highs.
Advanced Tip
Professional traders use delta volume or footprint charts to distinguish whether orders were executed aggressively or absorbed. When buy volume dominates but price fails to rise, inducement is likely forming.
How to Correct It
Always compare volume against recent averages.
Use order-flow indicators to confirm liquidity absorption.
Recognise that high volume without displacement often means a trap.
Mistake 5: Neglecting Psychological Bias
The final and most dangerous mistake is psychological. Inducement exploits human emotion. When traders see a sudden move, their instincts shout “do not miss out.” This fear of missing out, or FOMO, drives them directly into liquidity traps.
Why Psychology Matters
Inducement setups are designed to trigger impatience. They look like confirmation of momentum but are often the final move before reversal. Recognising inducement in trading requires emotional neutrality, something most beginners lack.
Behavioural Finance Insight
A 2024 study by the University of Reading found that traders under time pressure were 40 percent more likely to misinterpret chart patterns as entry signals. Inducement thrives on this urgency. The market waits for traders to act impulsively, then punishes them for doing so.
Real-Life Example: NASDAQ 100, March 2025
On 14 March, NASDAQ surged 1.2 percent intraday after strong tech earnings. Social media channels buzzed with “new breakout confirmed.” Retail traders piled in, pushing futures above 18,050. Yet institutional order data showed large sell orders entering the book at that level. By the next morning, the index had dropped 2.3 percent to 17,630. The breakout was the inducement, feeding on public optimism.
How to Correct It
Avoid chasing price after strong candles.
Use rules for confirmation: minimum candle close beyond liquidity, structure alignment, and follow-through.
Journal emotional responses after each trade to identify patterns of impulsive behaviour.

How to Correctly Identify Inducement in Trading
Recognising inducement consistently requires combining structure, liquidity, and context. Follow these five steps:
Identify key structure: mark swing highs and lows where stop-losses are likely clustered.
Locate liquidity pools: equal highs, equal lows, or clean ranges often hold retail orders.
Watch for minor false moves: a quick spike toward those levels signals inducement.
Confirm with volume and momentum: look for a surge in activity followed by rejection.
Enter after displacement: wait for a clear move away from the trap before entering.
Example for Inducement in Trading: EUR/USD, August 2025
The pair traded near 1.0970 with equal highs above. Volume spiked, price tapped 1.0985, and reversed 70 pips lower within hours. Those who recognised the inducement waited for displacement confirmation at 1.0950 and entered short, catching the continuation to 1.0900. Patience and structure awareness turn false signals into high-probability trades.
Building an Inducement-Aware Trading Routine
To make inducement analysis part of your daily process, integrate it into your pre-market and post-market routines.
Morning Routine
Mark previous day’s highs and lows on all major pairs. Highlight zones where liquidity is likely to rest. Note upcoming economic data that may trigger inducement setups.
During Session
Watch for volume spikes and sudden wicks near marked zones. Confirm direction with displacement before entering. Avoid impulsive trades after news releases.
After Session
Journal every inducement trade: what you saw, why you entered or skipped, and how the price reacted. Backtest over weekends to see if your identification process aligns with actual sweeps.
Retail trading analytics in 2025 suggest that traders who integrate inducement analysis and journaling reduce false entries by 22 percent within three months.
The Future of Inducement Analysis
As artificial intelligence evolves, inducement detection is moving beyond human recognition. Machine-learning algorithms in advanced trading platforms now highlight potential liquidity traps automatically. These systems scan millions of data points in real time, comparing order flow, volume divergence, and price fractals.
However, as tools improve, institutions adapt. They create multi-layer inducements — sequences of fake signals that mislead both retail traders and automated bots. The real edge will always come from understanding context, psychology, and the intent behind market behaviour.
By 2026, over 60 percent of retail platforms are expected to integrate inducement alerts into their technical packages. Yet no algorithm can replace the intuition and patience of a trader who understands what inducement truly represents: the market’s psychological manipulation of human bias.
FAQs About Inducement in Trading
Q1. Is inducement in trading the same as a fakeout?
No. A fakeout is the visible outcome; inducement is the process that causes it. Inducement attracts traders into the wrong direction before the market reverses.
Q2. Can inducement occur in all markets?
Yes. Inducement in trading appears in forex, stocks, commodities, and crypto. Wherever liquidity concentrates near obvious highs or lows, inducement follows.
Q3. Does inducement always lead to reversal?
Not always. Some inducements are continuation traps where price briefly reverses before resuming trend. Context determines outcome.
Conclusion
Inducement in trading is more than a buzzword; it is the mechanism that powers modern liquidity. Every sharp wick, every fake breakout, and every sudden reversal reflects the same truth: markets move because traders are induced to act prematurely.
By avoiding these five mistakes, traders can move from being liquidity to using liquidity. Recognise the difference between setup and execution, align your analysis across timeframes, confirm with volume, and master your emotions. In an age where algorithms dominate, human patience remains the ultimate edge.
Learning to read inducement correctly transforms frustration into insight. The next time the market tempts you to jump in, pause and ask, “Who is being induced, me or them?”
Disclaimer: This material is for general information purposes only and is not intended as (and should not be considered to be) financial, investment, or other advice on which reliance should be placed. No opinion given in the material constitutes a recommendation by the author that any particular investment, security, transaction, or investment strategy is suitable for any specific person.


