Published on: 2025-04-16 Updated on: 2025-10-07

The Weighted Moving Average (WMA) works more like a GPS, giving extra focus to what’s happening right now while still considering the road behind you.
This guide breaks down WMA in simple terms, shows how it differs from other moving averages, and explains how traders can use it to make smarter, quicker decisions in today’s fast-moving forex markets.
The Weighted Moving Average (WMA) is a type of moving average that gives more importance to recent prices and less to older ones.

This makes it react faster to market changes compared to the Simple Moving Average (SMA), which treats all prices equally.
Traders use WMA to spot short-term momentum shifts, confirm trends, and find entry or exit points. Because it’s more sensitive to price action, it’s often preferred in fast-moving markets like forex, stocks, and crypto, but it can also produce more false signals if the market is choppy.
The calculation of a WMA involves multiplying each closing price in the chosen period by a weight.
For example, in a 5-day WMA, the most recent day is multiplied by 5, the previous day by 4, and so on, down to 1.
The sum of these weighted prices is then divided by the total of the weights (in this case, 1+2+3+4+5 = 15).
WMA Formula:
WMA = (P1 × n + P2 × (n-1) + ... + Pn × 1) / (n + (n-1) + ... + 1)
Where:
P = Price at each period
n = Number of periods
This approach gives the WMA its characteristic responsiveness, allowing it to track price movements more closely than the SMA.
Moving averages aren’t one-size-fits-all. The Weighted (WMA), Simple (SMA), and Exponential (EMA) Moving Averages each handle price data differently, affecting how fast they react to market changes.
Knowing their strengths and limits helps traders pick the right tool. The table below shows the key differences.
| Feature | WMA (Weighted Moving Average) | SMA (Simple Moving Average) | EMA (Exponential Moving Average) |
|---|---|---|---|
| Weighting | Linear weighting (recent data prioritized) | Equal weighting | Exponential weighting (recent data prioritized) |
| Responsiveness | High | Low | Medium to high |
| Best Suited For | Trend entries and momentum shifts | Long-term smoothing | Blend of trend and momentum detection |
| Risk | More false signals in choppy markets | May lag when trends shift | May overreact in volatile markets |
The WMA is particularly useful for traders who want a moving average that is more sensitive to recent price changes but not as reactive as the EMA.
Spotting Trends
The WMA helps traders see whether the market is moving up or down. If the line is sloping upward, it suggests an uptrend. If it’s sloping downward, it points to a downtrend. Since the WMA reacts faster than the SMA, it can highlight trend changes earlier.
Support and Resistance Levels
The WMA often acts like a “moving line” of support or resistance. In an uptrend, prices may dip toward the WMA before bouncing back up. In a downtrend, the WMA can act like a ceiling that prices fail to break above.
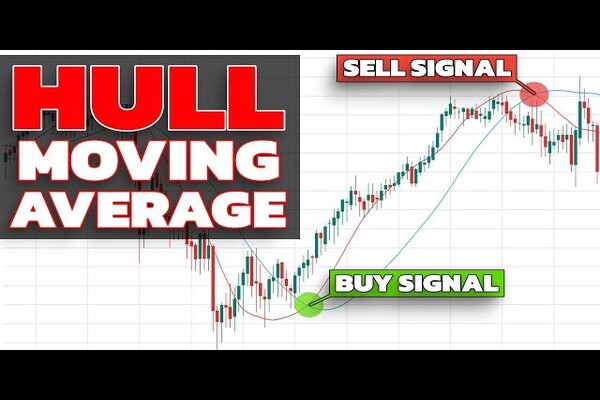
Crossover Signals
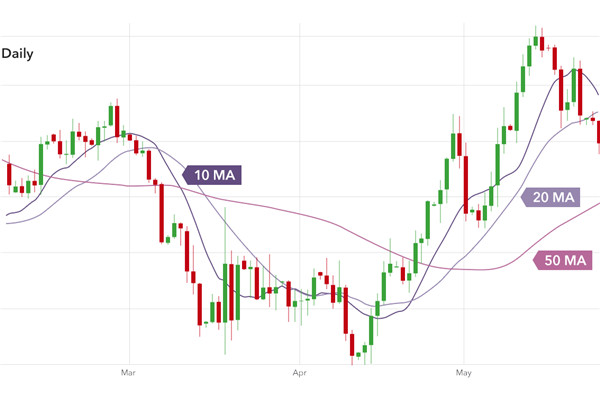
Short-period WMAs (such as 5 or 9 days) are popular for day trading and swing trading, as they react quickly to price changes. Longer-period WMAs (such as 50 or 200 days) are used to identify major trend shifts and provide a broader view of market direction.
Advantages
More responsive than SMA
Helps identify trend shifts earlier
Usable across asset classes and timeframes
Limitations
Prone to false signals in choppy markets
Very sensitive, especially in volatile asset conditions
Works best with confirmation from other indicators
Combine with Other Indicators: Use the WMA alongside tools like the Relative Strength Index (RSI) or Moving Average Convergence Divergence (MACD) for confirmation.
Adjust the Period: Experiment with different WMA periods to find the best fit for your trading style and the asset’s volatility.
Backtest Your Strategy: Test your WMA-based strategies on historical data to ensure they perform well in various market conditions.
Risk Management: Always use stop-loss orders and proper position sizing to manage risk, especially when trading with more sensitive indicators like the WMA.
It is used to track trends, generate signals, and highlight dynamic support/resistance areas.
While both give more weight to recent prices, WMA uses linear weights whereas EMA uses exponential smoothing.
Short-term traders often use 5–14 WMAs; swing traders use 20–50; long-term investors may prefer 100 or 200 WMA.
Yes. Many traders apply WMA to forex, stocks, crypto, and commodities to capture fast-paced price moves.
It is recommended to always pair it with trend filters, momentum indicators, or price action confirmation to reduce false signals.
The Weighted Moving Average (WMA) offers traders a sharper, more responsive lens into price trends by prioritizing recent data. When used properly through crossovers, bounce strategies, and slope analysis, WMA helps you detect momentum early and make clearer trade decisions.
As markets evolve in 2025, mastering WMA strategies gives you an edge: faster entries, better trend validation, and more confidence in your setups.
Disclaimer: This material is for general information purposes only and is not intended as (and should not be considered to be) financial, investment or other advice on which reliance should be placed. No opinion given in the material constitutes a recommendation by EBC or the author that any particular investment, security, transaction or investment strategy is suitable for any specific person.