Published on: 2025-07-07 Updated on: 2025-09-26

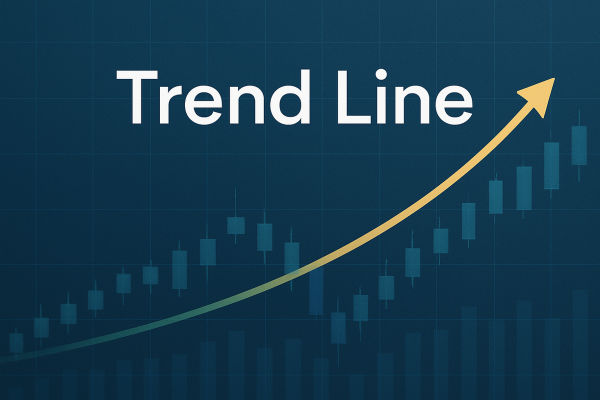
Trendline trading is one of the most fundamental and powerful techniques used by traders to identify price direction, entry points, and potential reversals.
Despite its simplicity, it plays a crucial role in technical analysis and is often used in conjunction with other trading tools to enhance the accuracy of trades.
If you're looking to master trendline trading, this guide will help you understand how to draw, interpret, and trade with trendlines effectively.

Trendline trading involves using diagonal lines on a price chart to determine the direction of a market trend. These lines connect significant price points, such as swing highs and swing lows, to visually represent the market momentum.
A trendline helps traders:
Identify the prevailing trend (uptrend, downtrend, or sideways)
Spot potential reversal zones
Determine ideal entry and exit points
Unlike moving averages or other lagging indicators, trendlines provide a more immediate sense of market sentiment and can be manually drawn to fit different trading styles and timeframes.

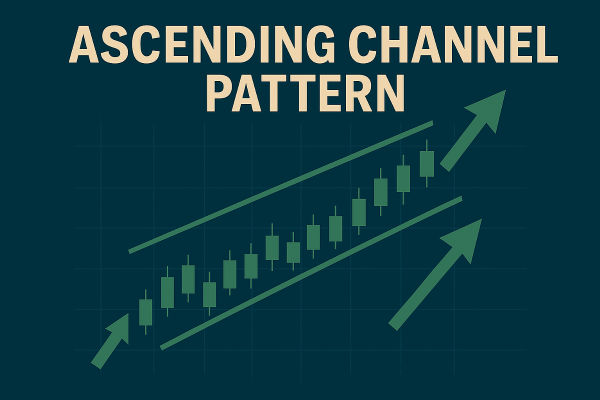
An uptrend line is created by linking a sequence of ascending lows on the chart. It suggests that demand exceeds supply, and prices are typically rising. This type of trendline acts as support and is used to identify long (buy) entries.
A downtrend line links a sequence of decreasing peaks. It suggests that supply is outweighing demand, and the price is moving downward. It acts as resistance and helps traders find short (sell) opportunities.
Some markets also show horizontal trendlines in consolidation or ranging phases. These can be useful for breakout and support-resistance strategies.

The effectiveness of a trendline heavily depends on how well it's drawn. A poorly drawn line can lead to false signals and bad entries. Here's a step-by-step way to draw trendlines:
Identify at least two swing highs or lows: You need at least two price points to draw a valid line, but three points improve its reliability.
Connect the points with a diagonal line: In an uptrend, connect the higher lows. In a downtrend, connect the lower highs.
Avoid forcing a trendline: Don't draw lines just to fit your bias. A trendline must reflect the real price structure.
Use the same scale: Consistently apply trendlines on the same timeframe to prevent discrepancies.
Once the trendline is set, monitor how the price reacts when it approaches the line. Repeated tests and bounces increase the line's strength.
While drawing a trendline seems simple, validating its effectiveness requires discipline. Here are some rules to ensure you're using them correctly:
The more touches, the stronger the trendline: A trendline that has been respected by price multiple times is more reliable.
Angles matter: Very steep trendlines are likely to break quickly, while flatter ones tend to hold longer.
Avoid cutting through candles: Trendlines should connect the wicks or bodies, not arbitrarily pass through price action.
Don't ignore timeframes: A trendline on the 1-hour chart may be insignificant on the daily chart. Validate across timeframes for accuracy.
Trendlines are most effective when used as part of a Trading plan that includes specific entry and exit rules. Here's how to incorporate them into your strategy:
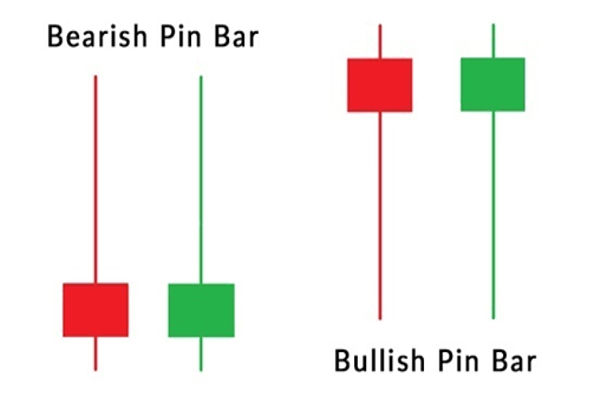
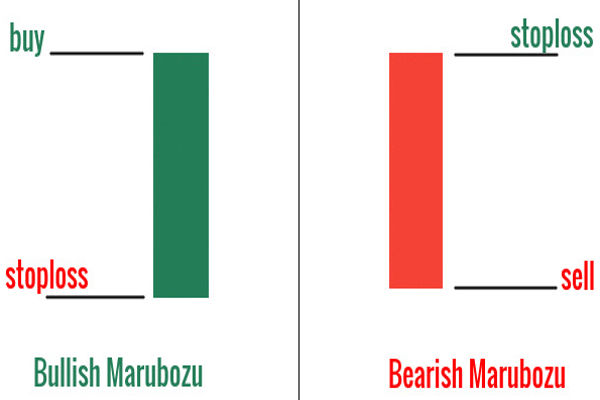
In an uptrend, wait for the price to pull back toward the trendline and look for signs of support. Once the price respects the trendline with a bullish candlestick or volume confirmation, it's a potential buy signal. Traders often place stop-loss orders just below the trendline to manage risk.
In a downtrend, the price may pull back to the trendline and then resume falling. It offers a short opportunity. Enter the trade once the price reacts bearishly at the trendline. Place stop-loss orders slightly above to limit potential losses.
A trendline break can signal a reversal or major shift in market sentiment. If the price breaks a well-respected trendline with strong momentum, it may indicate the start of a new trend. Combine this signal with volume spikes or candlestick confirmation for higher accuracy.
While trendlines are effective on their own, combining them with other tools can significantly improve your analysis and trade execution.
Trendlines paired with moving averages such as the 50-day or 200-day MA can help confirm trend strength or potential reversal. If both indicate upward momentum, it reinforces a long setup.
When RSI aligns with a trendline test (e.g., RSI is oversold near an uptrend line), it boosts the reliability of the signal.
You can combine Fibonacci levels with trendlines to find high-probability confluence zones. For example, a price bounce near the 61.8% level also coincides with a trendline, which often indicates a strong support area.
Volume can validate trendline signals. A breakout above a downtrend line on high volume is more credible than a breakout with weak participation.
Trendlines are extremely popular in forex due to the highly technical nature of the currency market. Major currency pairs often respect trendlines precisely, making them effective for short-term scalping or longer-term swing trading.
In equities, trendlines are used to identify price momentum in individual stocks or indices. Price gaps, earnings reports, and institutional flows can influence how well trendlines hold.
Commodities like gold or oil tend to trend for extended periods. Trendlines help traders identify key breakout or reversal levels, especially during geopolitical events or supply shocks.
Indices like the S&P 500 or Nifty 50 often trend for months. Drawing trendlines on these charts can offer excellent opportunities for positional trading or hedging.

Trendlines serve several critical purposes in trading:
They simplify chart analysis: Trendlines filter out the noise, offering a clearer picture of market direction.
They aid in market timing: Properly drawn trendlines provide cues for when to enter or exit a trade.
They work across all markets: Whether you're trading forex, stocks, indices, or crypto, trendlines are universally applicable.
They are dynamic support and resistance levels: Unlike horizontal lines, trendlines move with price action, adapting to real-time changes.
In volatile markets, trendlines give traders the structure they need to maintain discipline and consistency.
Yes, trendlines remain as relevant as ever. Despite the rise of algorithmic trading and AI-driven strategies, human traders continue to rely on visual patterns and classic price action tools.
As long as traders react to trends and significant levels, trendlines will stay a fundamental part of trading strategies.
In conclusion, trendline trading simplifies complex price behaviour into actionable insights. It enables traders to grasp momentum, spot entry points, and predict reversals in various markets.
For long-term success, combine trendlines with sound risk management, practice, and consistent refinement of your strategy.
Disclaimer: This material is for general information purposes only and is not intended as (and should not be considered to be) financial, investment or other advice on which reliance should be placed. No opinion given in the material constitutes a recommendation by EBC or the author that any particular investment, security, transaction or investment strategy is suitable for any specific person.