The fractal indicator is a widely used tool in technical analysis, helping traders identify potential reversals in the market. Its simplicity and effectiveness make it a favourite among both novice and experienced traders. Understanding how to apply the fractal indicator properly can significantly enhance your trading strategy and risk management.
In this article, we explore the top five ways to use the fractal indicator to achieve better trading outcomes.
What Is the Fractal Indicator?

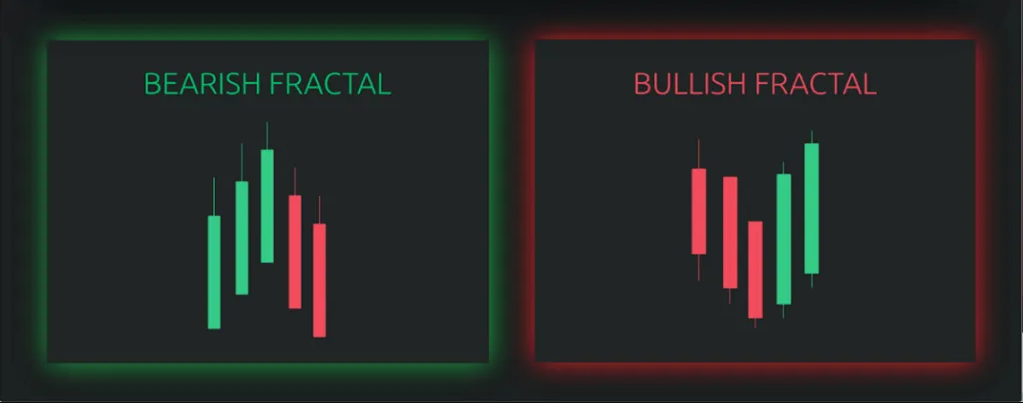
The fractal indicator is a technical analysis tool that highlights patterns of price reversals on a chart. It identifies groups of five consecutive bars where the middle bar has the highest high (in an up fractal) or the lowest low (in a down fractal).
Developed by Bill Williams, the fractal indicator serves as a building block for recognising larger trends and market turning points. Traders use it to spot areas where the market may change direction, either upward or downward.
5 Ways to Use the Fractal Indicator

1. Identifying Trend Reversals
One of the most common uses of the fractal indicator is spotting trend reversals. By placing an up fractal over the highest high or a down fractal below the lowest low, the indicator gives a visual signal that the current trend may be coming to an end.
When several fractals align in the opposite direction of the current trend, it can be a strong hint that a reversal is on the horizon. Traders often combine the fractal indicator with other tools like moving averages to confirm the reversal signals before making trading decisions.
2. Setting Entry Points
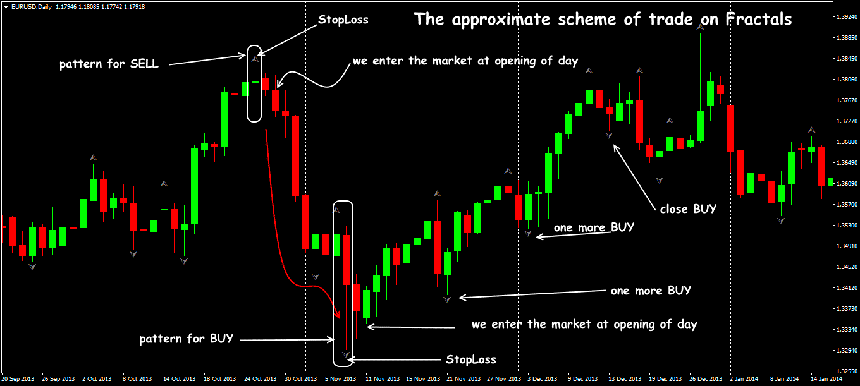
The fractal indicator can also be an excellent tool for defining entry points. Traders may wait for a breakout above an up fractal to enter a long position or a breakout below a down fractal to initiate a short position.
This method helps in avoiding false signals and ensures that trades are placed in the direction of momentum. Using the fractal indicator to identify these critical price levels gives traders a structured approach to entering the market rather than relying solely on guesswork.
3. Establishing Stop Loss and Take Profit Levels
Another effective way to use the fractal indicator is in setting stop loss and take profit points. When entering a trade, placing a stop loss just beyond the most recent fractal can protect against excessive losses if the market moves against the position.
Similarly, take profit levels can be set near the next significant fractal point. This strategy provides a logical basis for exiting trades, enhancing risk management and promoting disciplined trading practices.
4. Confirming Breakout Strategies
Breakouts are critical moments in trading where price moves sharply beyond established support or resistance levels. The fractal indicator can play a crucial role in confirming these breakouts.
When a price breaks above a key up fractal or below a key down fractal, it suggests a genuine breakout rather than a temporary spike. Combining the fractal indicator with volume analysis or other momentum indicators can provide even stronger confirmation that the breakout is likely to be sustained.
5. Combining with Other Technical Tools
The fractal indicator is most powerful when used alongside other technical analysis tools. For instance, combining fractals with the Alligator indicator (another creation of Bill Williams) can help traders identify when the market is trending or consolidating.
Similarly, pairing the fractal indicator with tools like RSI, MACD, or Bollinger Bands can refine signals and reduce the likelihood of false entries. Successful traders often use a multi-indicator approach to validate the signals given by the fractal indicator before taking action.
Common Mistakes When Using the Fractal Indicator
While the fractal indicator is highly effective, traders must be cautious of certain pitfalls. One common mistake is relying on the fractal indicator alone without any confirmation from other tools. Markets can produce many fractals during periods of high volatility, leading to potential confusion and false signals.
Another mistake is ignoring the broader market context. Fractals are best interpreted within the framework of larger trends, not in isolation. Always assess where the fractals are forming relative to longer-term support, resistance, and trend lines.
Advantages and Limitations of the Fractal Indicator
The fractal indicator offers several advantages. It is easy to understand, available on most trading platforms, and provides clear visual signals. Its ability to highlight potential turning points makes it a valuable addition to any trading strategy.
However, like any technical tool, the fractal indicator is not perfect. It often lags slightly because a fractal can only be identified after the pattern has formed. In fast-moving markets, this lag can sometimes result in missed opportunities.
Moreover, fractals are more reliable in trending markets than in choppy or sideways markets, where false signals are more common.
Conclusion
The fractal indicator is a simple yet powerful tool that can enhance your technical analysis and trading performance. Whether you use it to spot trend reversals, set strategic entry and exit points, confirm breakouts, or strengthen a multi-indicator strategy, the fractal indicator provides valuable insights into market behaviour.
To maximise its effectiveness, always combine the fractal indicator with other analytical tools and consider the broader market context. With practice and disciplined use, the fractal indicator can become a key part of a successful trading toolkit.
Disclaimer: This material is for general information purposes only and is not intended as (and should not be considered to be) financial, investment or other advice on which reliance should be placed. No opinion given in the material constitutes a recommendation by EBC or the author that any particular investment, security, transaction or investment strategy is suitable for any specific person.


