The MACD trading strategy is one of the most recognisable tools in technical analysis, yet many traders fail to use it to its full potential. Known formally as the Moving Average Convergence Divergence indicator, MACD was developed by Gerald Appel in the 1970s and remains a core component in many trading systems today. It offers traders insights into momentum, trend direction and potential reversals—all based on price action, not prediction.
Despite its popularity, there is a surprising number of traders who either misuse it or ignore it altogether. That’s where its overlooked edge comes in. Used properly, the MACD trading strategy can deliver more than just signals—it can offer structure, clarity and confidence in turbulent markets.
What Is the MACD Trading Strategy?

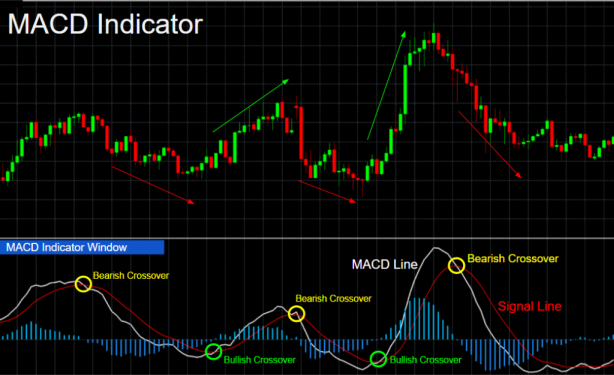
At its core, the MACD trading strategy involves tracking the relationship between two exponential moving averages (EMAs)—usually the 12-period and 26-period. The MACD line is created by subtracting the longer EMA from the shorter EMA. A 9-period EMA of the MACD line, known as the signal line, is then plotted to generate trade signals.
When the MACD line crosses above the signal line, it is commonly interpreted as a bullish signal. Conversely, when it crosses below, it may indicate bearish momentum. The MACD histogram, which plots the distance between the MACD and the signal line, provides additional insight into the strength of the move.
Why the MACD Trading Strategy Is Still Relevant
Many modern traders lean towards newer, more complex indicators, often overlooking the simplicity and reliability of the MACD trading strategy. However, simplicity can be an asset. The MACD is grounded in price action, free from external noise and adaptable to virtually any timeframe.
It works well in trending markets, where its crossover signals help confirm entries and exits. In ranging markets, it can still highlight momentum shifts that precede breakouts. The MACD is also useful in spotting divergences between price and momentum, which can be early signs of reversal.
Incorporating the MACD Trading Strategy into Your Plan

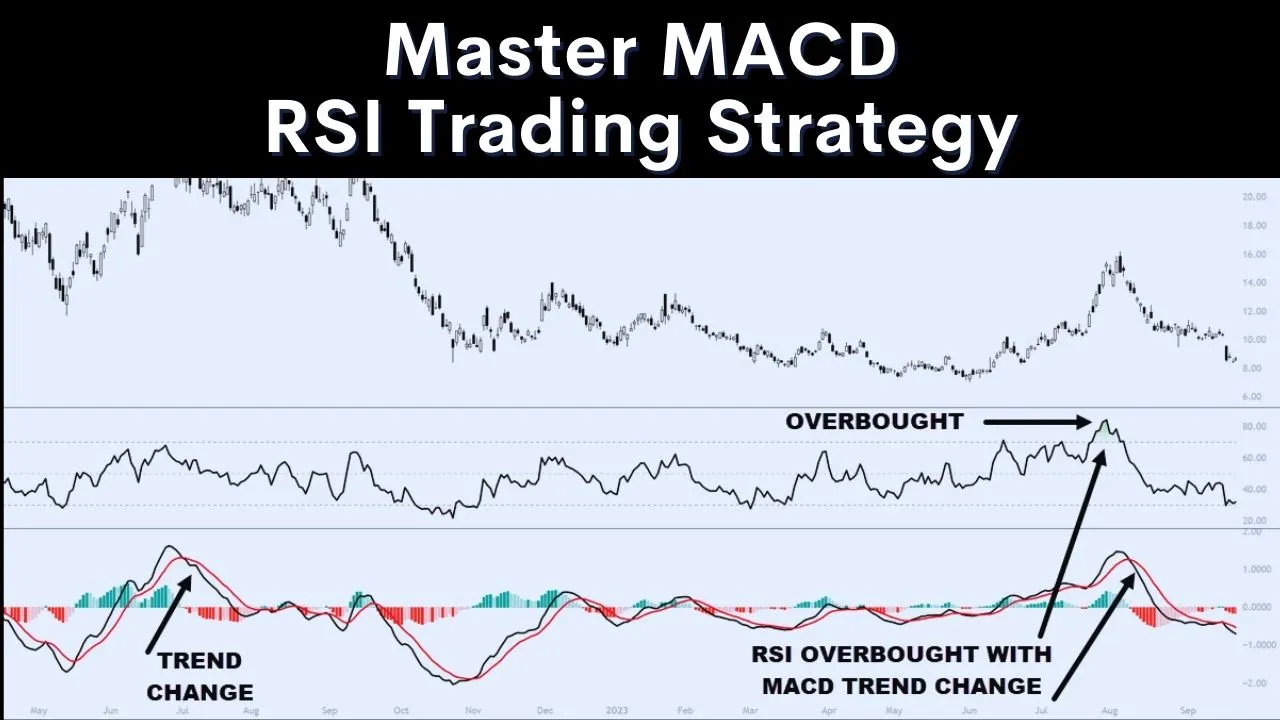
The true strength of the MACD trading strategy lies in how it’s integrated into a broader trading system. Used in isolation, it can provide false signals—especially in choppy conditions. But when paired with price action analysis, support and resistance levels or volume indicators, it becomes far more reliable.
For instance, a MACD crossover at a key support level may offer stronger conviction than a crossover in the middle of a flat range. Similarly, when the MACD confirms a breakout by shifting into positive territory with an expanding histogram, traders may find greater confidence in staying with the trend.
Common Mistakes When Using MACD
One of the biggest errors traders make with the MACD trading strategy is treating it as a standalone buy or sell signal. Like all indicators, MACD is a tool—not a crystal ball. It should be used in context.
Another common mistake is ignoring timeframes. The MACD can show bullish signals on a 1-hour chart while showing bearish momentum on the daily chart. Without aligning strategies across timeframes, traders risk conflicting information and poor decision-making.
Finally, overtrading MACD crossovers can lead to whipsaw losses. The strategy works best when confirmed by other tools or clear price structure.
The Overlooked Edge of MACD: Divergence Detection

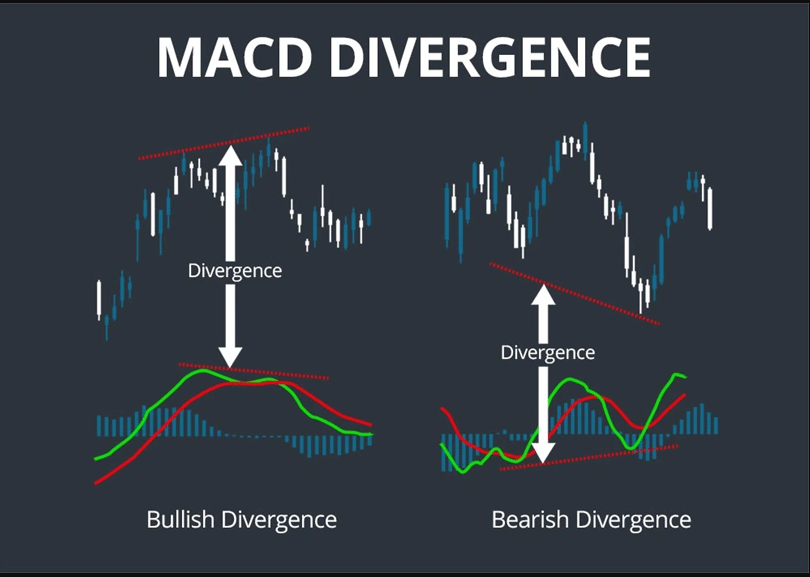
Perhaps the most underappreciated element of the MACD trading strategy is its ability to detect divergence. When price makes a new high but the MACD does not, it signals a potential loss of momentum. This divergence often precedes a reversal or correction.
Bearish divergence can alert traders to exit long positions or tighten stops. Bullish divergence, on the other hand, may highlight opportunity in downtrending markets—especially when price hits major support levels.
Divergence signals do not appear often, but when they do, they can mark major turning points. This subtle feature adds a predictive edge to an otherwise reactive tool.
Optimising Settings for Different Markets
While the default settings (12, 26, 9) work well for many assets, traders can optimise the MACD trading strategy by adjusting these parameters. For shorter-term trading, such as intraday strategies, reducing the settings to something like (5, 13, 8) can improve responsiveness. For longer-term investing, increasing the periods helps filter noise and provide a smoother signal.
Backtesting and forward testing are essential when making adjustments. Every market behaves differently, and optimal settings will vary depending on volatility, structure and trader objectives.
MACD in Action: Real-World Examples
Consider a scenario where a trader spots a MACD bullish crossover on a 4-hour chart of gold. The histogram starts to widen, confirming momentum. The price is also approaching a previously tested support zone. By combining the MACD trading strategy with market structure and risk management, the trader can enter with greater confidence and a well-defined exit.
Another example: a bearish divergence between the MACD and price on the S&P 500 weekly chart precedes a major correction. Traders who recognised this signal early were able to adjust their portfolios or hedge risk before the broader sell-off.
These cases show that the MACD trading strategy is more than theory—it can provide actionable signals with proper context.
Final Thoughts
The MACD trading strategy offers traders a balance of simplicity and depth. It is not a magic bullet, but in skilled hands, it becomes a powerful weapon in the technical analysis arsenal. Its ability to confirm trends, identify momentum shifts and highlight divergence makes it a versatile tool across market conditions.
Most importantly, its edge lies not in its settings, but in the trader’s understanding of how to apply it thoughtfully. Those who look beyond the basics often find that the real advantage of the MACD trading strategy is how it sharpens their decision-making.
Disclaimer: This material is for general information purposes only and is not intended as (and should not be considered to be) financial, investment or other advice on which reliance should be placed. No opinion given in the material constitutes a recommendation by EBC or the author that any particular investment, security, transaction or investment strategy is suitable for any specific person.


