Published on: 2023-11-21 Updated on: 2025-09-26

Markets develop alongside algorithmic trading, AI analysis tools, and sophisticated charting platforms. However, the K-Line chart remains one of the most widely used tools worldwide.
Why? Because K-Line (candlestick) visualise the market's emotions: fear, greed, hesitation, in a way that's instantly understandable. Whether you trade stocks, forex, or crypto, candlesticks are a universal language of price action.
In this guide, we'll explain what K-Line charts are, how to read them, which patterns matter most, and how modern traders use them effectively.

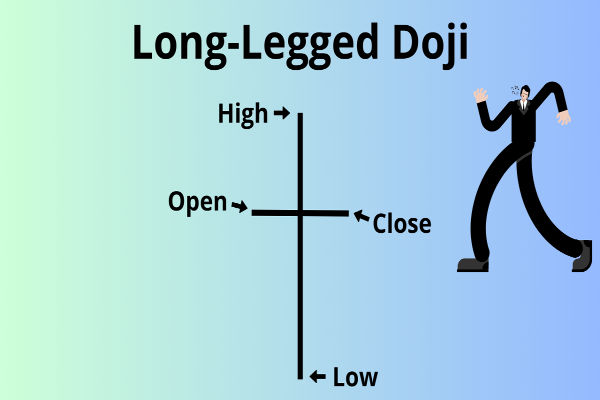
A K-Line chart, often referred to as a candlestick chart, illustrates price movement over a specified duration (1 minute, 1 day, 1 week, etc.). Each candle shows:
Open: Price at the beginning of the session.
Close: Price when the session ended.
High: Highest price traded.
Low: Lowest price traded.
A candle has two key parts:
Body: The rectangle between open and close.
Wicks (shadows): Thin lines showing the highs and lows.
Colour Coding
Green / White candle: Close is higher than open → bullish session.
Red / Black candle: Close is lower than open → bearish session.
Historical Note: Candlestick charting originated in 18th-century Japan, credited to rice trader Munehisa Homma. His methods evolved into what we now call candlestick or K-Line charts, popularised in the West by Steve Nison in the 1990s.

Long body → strong buying or selling pressure.
Short body → indecision or consolidation.
A long upper shadow → buyers pushed price up, but sellers pulled it back (bearish signal if near resistance).
A long lower shadow → sellers drove the price down, but buyers bounced back (bullish indication if close to support).
A series of green candles → uptrend momentum.
A series of red candles → downtrend momentum.
A single candle means little without context. Traders combine candlestick readings with trendlines, moving averages, and support/resistance to confirm signals.

To no trader's surprise, candlestick charts are powerful because they form patterns that traders use to predict possible market moves.
Listed below are several K-line charts you should recognise before trading:
Doji: Open ≈ Close → indecision; often signals reversal if after a trend.
Hammer: Small body at top with long lower shadow → bullish reversal if found after a downtrend.
Inverted Hammer: Small body at bottom with long upper shadow → possible bullish reversal.
Spinning Top: Small body with long shadows → uncertainty, often consolidation.
Bullish Engulfing: Large green candle fully engulfs prior red candle → bullish reversal.
Bearish Engulfing: Large red candle engulfs prior green candle → bearish reversal.
Piercing Line: Red candle followed by green candle closing above midpoint → bullish.
Dark Cloud Cover: Green candle followed by red candle closing below midpoint → bearish.
Morning Star: Bearish → indecision → bullish; signals reversal upward.
Evening Star: Bullish → indecision → bearish; signals reversal downward.
Tweezer Tops/Bottoms: Matching highs or lows across candles → reversal signal.
Three White Soldiers: Three long green candles → strong bullish continuation.
Three Black Crows: Three long red candles → bearish continuation.
| Pros | Cons |
|---|---|
| Easy to read visually | Can give false signals in sideways markets |
| Works across all markets (stocks, forex, crypto, commodities) | Pattern interpretation can be subjective |
| Reveals psychology behind price moves | Needs confirmation with other tools |
For beginners, the best approach is to start with the Doji, Hammer, and Engulfing. These form the foundation of candlestick interpretation.
Additionally, it is essential to validate each signal with volume or an indicator such as RSI or moving averages, instead of relying on them alone.
Before risking real money, many new traders benefit from paper trading or demo accounts, practising candlestick recognition in live market conditions.
And when moving into real trades, risk management should always come first: stop-loss orders and careful position sizing are essential because candlestick patterns are never 100% accurate.
It's another name for a candlestick chart, which shows open, close, high, and low prices.
Engulfing, Morning/Evening Stars, and Three Soldiers/Crows when confirmed with volume.
Yes, especially when combined with indicators and trend analysis.
Yes, they are universal across all liquid markets.
In conclusion, K-Line charts remain a core trading tool in modern trading, bridging traditional charting wisdom with AI-powered enhancements.
The takeaway:
Use candlesticks to read market psychology,
Confirm with indicators & context,
Apply them as part of a balanced trading strategy.
Whether you're analysing forex, stocks, or crypto, mastering K-Lines will make you more confident in navigating market moves.
Disclaimer: This material is for general information purposes only and is not intended as (and should not be considered to be) financial, investment or other advice on which reliance should be placed. No opinion given in the material constitutes a recommendation by EBC or the author that any particular investment, security, transaction or investment strategy is suitable for any specific person.