Gold Price Forecast Today: Key Levels and Trading Outlook

2025-06-24
Summary:

Gold (XAU/USD) slips toward $3.316 as technical signals weaken; key levels, trade setups, and market drivers analysed in detail.

Gold has found itself at a crossroads, buffeted by geopolitical headlines, a firm U.S. dollar, and shifting momentum indicators. Below is a detailed examination of today's XAU/USD price dynamics, key levels and trade strategies—grounded firmly in live market data and expert sentiment.


Current Price Action & Technical Signals
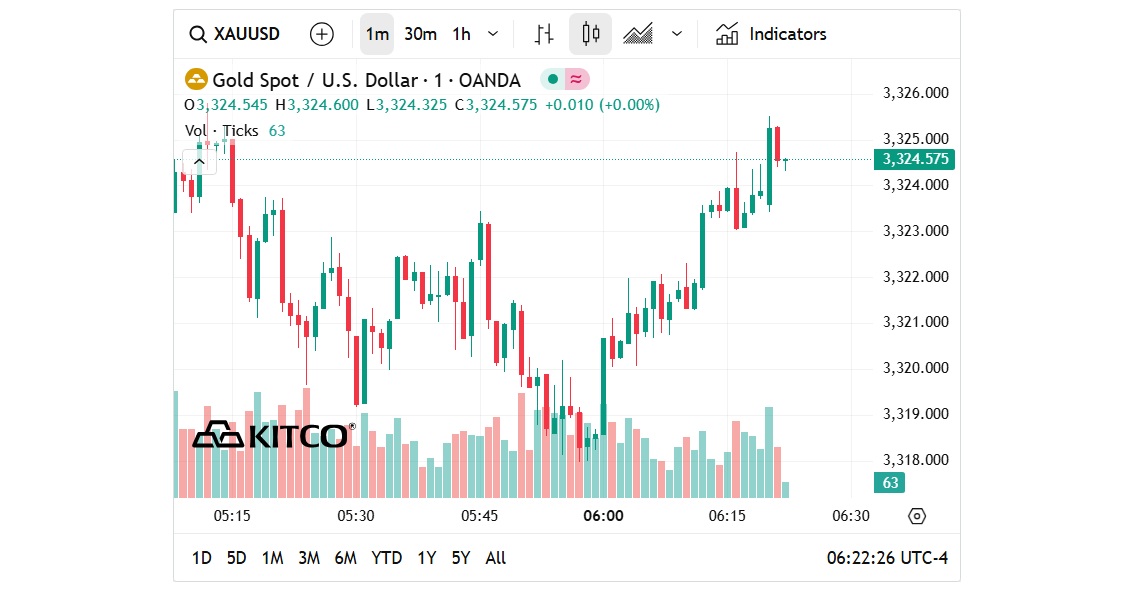
Gold Price Today

  • Spot range: XAU/USD is trading at approximately $3.320.90. off roughly 1.4% for the day, mirroring the intraday range of $3.316–$3.369.


  • Technical bias: Investing.com's technical panel flags a "Strong Sell" across moving averages and indicators like RSI and MACD.


  • Chart patterns: Recent session saw the price drop below the 50‑day EMA (~$3.359), rejecting resistance and forming a descending channel.


  • Oscillators: RSI around 31.6 on 4‑hour charts indicates deep oversold conditions, suggesting momentum may be exhausted.


Key Support & Resistance Zones


Support Levels:

  • $3.316–$3.320: Intraday swing low and today's floor.

  • $3.305–$3.300: Next tier, aligns with recent lows and June's downward trend .

  • $3.297: Marks the 38.2% Fibonacci retracement of April–June rally.


Resistance Levels:

  • $3.350–$3.352: Bundles 50‑ and 21‑day SMAs, which proved strong yesterday.

  • $3.369–$3.370: Recent intraday top and psychological threshold.

  • $3.400: A lofty psychological barrier and upper Fibonacci zone.


Indicative Technical Indicators

Indicative Technical Indicators
Indicator Current Signal Interpretation
RSI (14) ~31.6

Heading deep into oversold territory

MACD Bearish histogram Momentum remains weak under current price levels
Moving Averages All EMAs/SMA signalling "Sell" Confirms near-term downtrend
Pivot Points (Classic) Pivot at ~$3,328; support ~3,316 risk Price hovering near key daily inflection


These indicators point toward a bearishly tilted short-term outlook, though the stretched RSI hints at the likelihood of a bounce if $3.316 holds strong.


Suggested Short-Term Trade Setups


Bearish Setup

  • Entry: Short on break below $3.316

  • Initial Target: $3.305. then $3.297

  • Stop-Loss: $3.335

  • Rationale: Daily technicals remain bearish; downside may extend to Fibonacci support with confirmed breakdown.


Bullish Reversal Setup

  • Entry: Long above $3.350

  • Targets: $3.369. $3.400

  • Stop-Loss: $3.330

  • Rationale: A decisive push above the 21/50-day SMA zone may trigger a corrective rebound; pivot zone invalidates bearish case.


Tactical note: Near-term scalpers might also capitalise on intraday RSI divergence fade plays off $3.316. Keep both macro events and chart thresholds in view.


Near-Term Outlook & Primary Catalysts


  • U.S. Dollar Strength: DXY remains elevated – a strong dollar continues to pressure gold.


  • Middle East Developments: The Israel–Iran conflict remains a wildcard. Recent ceasefire news saw gold dip, but further escalation could reignite safe-haven demand fxstreet.com+3fxstreet.com+3reuters.com+3.


  • Fed & Economic Data: Today's Powell testimony, plus economic releases like CPI or PMIs, may shift market expectations on the timing of Fed cuts and thus influence gold.


  • Oil and Risk Appetite: Softer oil prices and better risk sentiment tend to hinder gold, while spikes in oil can bolster it.


Conclusion


Gold is currently navigating a fragile technical environment within a broader downtrend. The RSI is deeply oversold, suggesting a bounce is probable—but only if $3.316 holds. Traders should:


  • Play defensively: Trade confirmed breaks above $3.350 or below $3.316.


  • Manage risk tightly, especially around key moving averages and pivot zones.


  • Stay alert to macro news—particularly Fed commentary and evolving geopolitical developments—that could upheave technical setups overnight.


In such volatile terrain, the most effective plays are those based on technical confirmation, disciplined stops, and acute awareness of market context.


Disclaimer: This material is for general information purposes only and is not intended as (and should not be considered to be) financial, investment or other advice on which reliance should be placed. No opinion given in the material constitutes a recommendation by EBC or the author that any particular investment, security, transaction or investment strategy is suitable for any specific person.

SDY ETF: A Reliable Source of Dividend Income

SDY ETF: A Reliable Source of Dividend Income

Discover how the SDY ETF delivers steady income and defensive equity exposure through a portfolio of dividend-growing U.S. companies.

2025-06-24
7 Tips for Traders to Know About a Successful CFD Trade

7 Tips for Traders to Know About a Successful CFD Trade

Master CFD trading with these 7 essential tips, covering planning, risk management, analysis, and discipline for better results in any market.

2025-06-24
Know Sure Thing Indicator Explained: Formula and Strategies

Know Sure Thing Indicator Explained: Formula and Strategies

Learn how the Know Sure Thing Indicator works, including its formula, signals, and best strategies to identify market momentum effectively.

2025-06-24