Published on: 2025-07-01

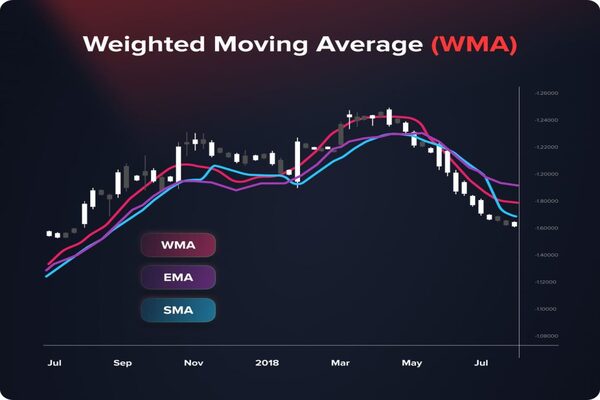
Moving averages are among the most reliable tools in a trader's technical analysis toolkit, helping to identify trends, smooth out price data, and generate entry or exit signals. Two of the most commonly used types—Simple Moving Average (SMA) and Exponential Moving Average (EMA)—serve similar functions but behave differently in response to market movements. Understanding how these averages differ in structure, sensitivity, and application can significantly sharpen a trader's edge across various market conditions.
 Both EMA and SMA are forms of moving averages, which help to filter out short-term market noise and better identify long-term price directions. By averaging historical prices over a specified time period, moving averages allow traders and analysts to observe the general direction of a market more clearly.
Simple Moving Average (SMA):
The SMA is calculated by summing the closing prices over a specific number of time periods and dividing the result by the number of periods. It gives equal weight to all prices in the period.
Exponential Moving Average (EMA):
The EMA, on the other hand, applies a greater weighting to more recent prices, making it more sensitive to new information. This gives traders a timelier signal in fast-moving markets.
Both indicators serve to highlight support and resistance levels, generate buy and sell signals, and help in recognising trend directions—but their responsiveness and signal accuracy can differ.
Understanding the formulas behind these averages helps traders appreciate how they behave under different market conditions.
SMA Formula:

EMA Formula:
![]()
Where the Multiplier is calculated as:

Unlike the SMA, which treats all past prices equally, the EMA prioritises the most recent data, making it more reflective of short-term price changes.
The EMA's primary advantage lies in its speed of reaction. Because it gives more emphasis to recent prices, it adjusts more quickly to changes in market conditions. This characteristic makes the EMA particularly suitable for short-term trading strategies, where early entry or exit points can be crucial.
In contrast, the SMA is slower to respond due to its equal weighting across the entire data set. This smoothing effect can be useful for identifying long-term trends but may delay signals during volatile or rapidly shifting markets.
| Characteristic | SMA | EMA |
| Weighting | Equal | Heavily weighted to recent |
| Reacts to change | Slower | Faster |
| Signal lag | Higher | Lower |
| Smoothing effect | Stronger (less noisy) | Less strong (more reactive) |
The choice between EMA and SMA often comes down to trading style and market conditions.
EMA for Short-Term Trading:
Day traders and swing traders often prefer EMAs because they provide quicker signals. Shorter EMAs, such as the 8-day or 21-day EMA, are frequently used to catch swift trend reversals and gain a trading edge.
SMA for Long-Term Investment:
Investors and position traders typically lean towards SMAs for their stability and simplicity. The 50-day and 200-day SMAs are well-known benchmarks used to determine overall market direction and to identify key support or resistance levels.
Example Applications:
A 20-day EMA might help a trader react promptly to an emerging breakout.
")
A 200-day SMA can signal the start or end of a long-term bull or bear market.

Both indicators come with their own benefits and limitations, and understanding these can help traders make more informed decisions.
EMA Advantages:
Reacts quickly to price changes
Captures momentum shifts early
Favoured in high-frequency or volatile markets
EMA Limitations:
Can produce false signals in choppy conditions
More susceptible to short-term noise
SMA Advantages:
Smoother, more stable signals
Better for long-term trend confirmation
Less likely to be affected by temporary volatility
SMA Limitations:
Reacts slowly to price shifts
May miss early trade opportunities
Combining Both: The Crossover Strategy
One popular application is to use both EMA and SMA together in a moving average crossover strategy. For instance:
A bullish signal may occur when the 50-day EMA crosses above the 200-day SMA (known as a Golden Cross).

A bearish signal may occur when the 50-day EMA falls below the 200-day SMA (known as a Death Cross).

These crossover techniques help traders confirm the strength of a trend and determine the ideal entry or exit point.
When comparing EMA vs SMA, there's no one-size-fits-all answer. The best moving average for a trader largely depends on their timeframe, strategy, and risk tolerance.
For those seeking speed and early signals in fast-moving markets, the EMA offers a sharper lens.
For those who value clarity and steadiness, particularly in longer-term analysis, the SMA remains a tried-and-true tool.
Ultimately, many seasoned traders employ both indicators in tandem, using them to complement one another and create more robust trading strategies. Whether you're a beginner or an advanced market participant, mastering these two moving averages is a foundational skill that can enhance your decision-making and trading performance.
Disclaimer: This material is for general information purposes only and is not intended as (and should not be considered to be) financial, investment or other advice on which reliance should be placed. No opinion given in the material constitutes a recommendation by EBC or the author that any particular investment, security, transaction or investment strategy is suitable for any specific person.