Published on: 2025-05-29

The bear flag pattern is a popular technical analysis tool used by traders to identify potential continuation of a downtrend. Recognising this pattern can help traders anticipate further declines and plan effective trade entries.
Here's a comprehensive guide to the main features of the bear flag pattern and how to spot it on price charts.

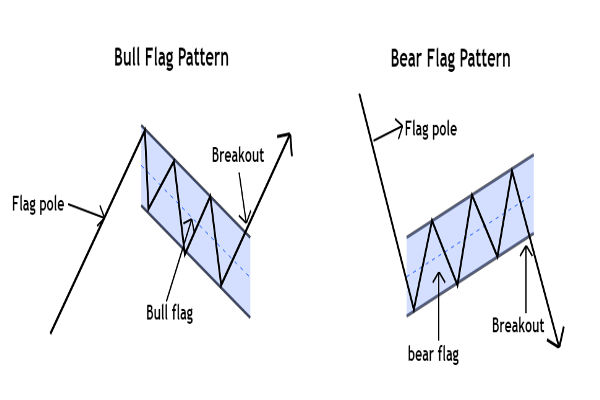
A bear flag pattern is a chart formation that signals a brief consolidation or pause in a prevailing downtrend, followed by a likely continuation of the bearish move. It consists of two main components:
Flagpole: A sharp, rapid price decline caused by strong selling pressure.
Flag: A short-term consolidation phase where price moves within a narrow, upward-sloping or horizontal channel, forming parallel trendlines.
This pattern is considered a "continuation pattern, meaning it suggests the existing downtrend is likely to resume once the consolidation ends.
1. Sharp Downward Move (Flagpole)
The pattern begins with a significant and rapid decline in price, forming the flagpole. This move is usually accompanied by high or increasing trading volume, indicating strong bearish sentiment.
2. Consolidation Phase (Flag)
After the initial drop, the price enters a consolidation phase. This is characterised by a narrow, upward-sloping or horizontal channel where the price moves between parallel trendlines. During this phase, volume typically decreases, reflecting a temporary balance between buyers and sellers.
3. Parallel Trendlines
The flag portion is defined by two parallel lines: the upper trendline connects the highs, and the lower trendline connects the lows. The flag usually slopes slightly upward or remains horizontal, counter to the direction of the flagpole.
4. Volume Patterns
A classic bear flag shows high volume during the flagpole's formation and lower volume during the flag's consolidation. A spike in volume often accompanies the breakout, confirming the continuation of the downtrend.
5. Breakout Confirmation
The pattern is confirmed when the price breaks below the lower trendline of the flag, ideally with increased trading volume. This breakout signals the likely resumption of the downtrend and presents a potential entry point for short trades.
To identify a bear flag pattern on a chart, look for these steps:
Identify a Strong Downtrend: Look for a sharp and significant price drop—the flagpole.
Watch for Consolidation: After the decline, check if the price enters a narrow, upward-sloping or horizontal channel (the flag).
Check Volume: Confirm that volume decreases during the flag's formation and increases on the breakout.
Draw Parallel Trendlines: Connect the highs and lows of the consolidation phase to form the flag.
Wait for the Breakout: The pattern is validated when the price breaks below the lower trendline, ideally with a volume surge.

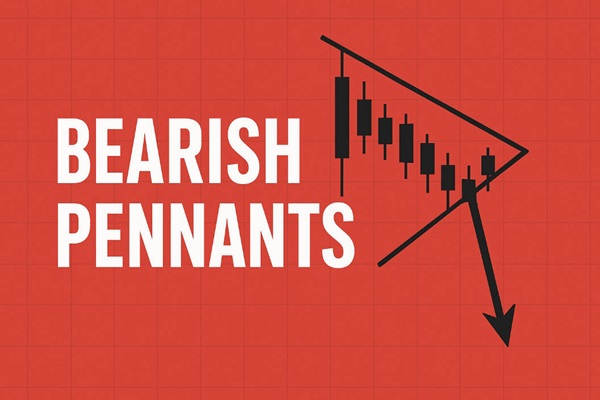
While both patterns signal a continuation of a downtrend, the bear flag's consolidation phase forms a rectangular channel with parallel trendlines, whereas a bear pennant forms a small symmetrical triangle with converging trendlines.
Entry Point: Consider entering a short position when the price breaks below the flag's lower trendline.
Profit Target: Measure the length of the flagpole and project it downward from the breakout point to estimate your profit target.
Stop Loss: Place a stop-loss order above the upper trendline of the flag to manage risk.
Volume Confirmation: Use volume as a key confirmation tool—a breakout with high volume is more reliable.
Combine with Indicators: Enhance your analysis by combining the bear flag with other technical indicators like moving averages or RSI.
The bear flag pattern is a reliable continuation signal for traders looking to capitalise on downtrends. By understanding its main features—sharp flagpole, parallel consolidation, and breakout confirmation—you can spot high-probability setups and manage trades more effectively.
Always use volume and other indicators to confirm the pattern and manage risk with appropriate stop-loss strategies.
Disclaimer: This material is for general information purposes only and is not intended as (and should not be considered to be) financial, investment or other advice on which reliance should be placed. No opinion given in the material constitutes a recommendation by EBC or the author that any particular investment, security, transaction or investment strategy is suitable for any specific person.
World's Best Broker