Commodities are the lifeblood of the global economy, fueling industries, powering nations, and feeding billions. From the crude oil that drives transport to the grains that sustain daily life, every tick in commodity prices ripples through global markets. Each day, billions of dollars in commodity trades shape inflation trends, corporate profits, and even geopolitical stability, making this market not just vast, but vital to how the world runs.
From energy and metals to agricultural products, commodities drive industrial production, fuel transportation, and feed billions of people. Investors and traders participate in commodity markets for profit, risk management, and portfolio diversification.
What Determines the Most Traded Commodities?
The most traded commodities earn their place at the top of global markets because they combine high trading volume, the sheer number of physical units or contracts exchanged, and strong trading value, the total worth of those transactions.
But numbers alone don’t tell the full story. A truly dominant commodity also shows deep liquidity, meaning it can be bought or sold quickly without major price swings. Add to that consistent global demand and price volatility, and you have the perfect mix that attracts everyone, from producers and institutional hedgers to speculative traders seeking opportunity.
In short, commodities like crude oil, gold, and copper dominate trade not only because of what they are, but because of how actively the world’s economies, investors, and industries depend on them every single day.
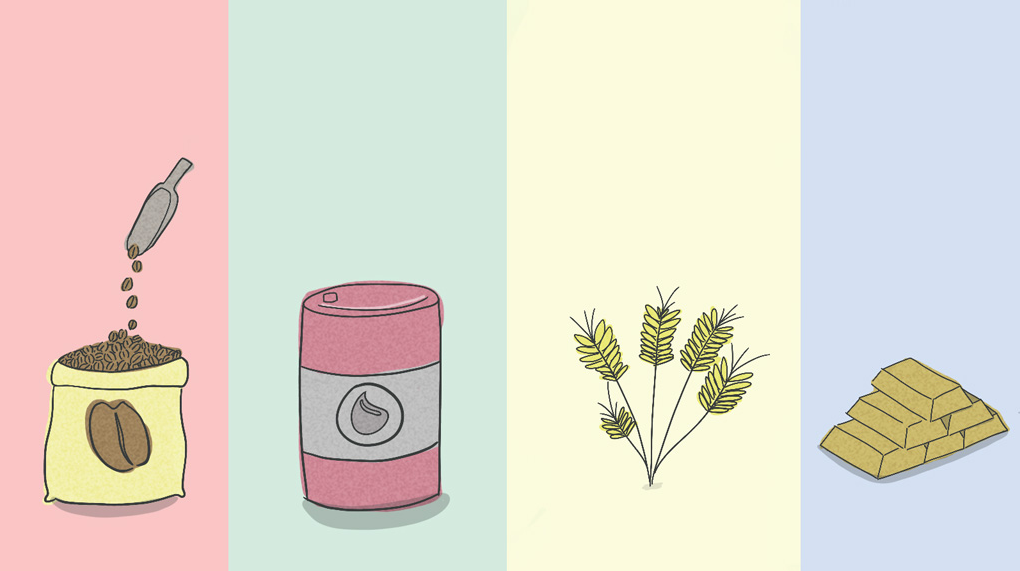
The 10 Most Traded Commodities Based on Volume and Value
| Commodity |
2024 Estimated Economic Value (USD) |
2024 Global Volume |
Q1-Q3 2025 Snapshot |
| Crude oil |
≈ $3.0 trillion |
~102.8 mb/d (~37.5 bn bbl/yr) |
Demand still near record; policy & OPEC+ keep volatility elevated. |
| Gold |
≈ $382 billion (total value of demand) |
Mine output ~3.4–3.7 kt |
Price/turnover at or near records in 2025; liquidity > $200B/day historically. |
| Natural gas (incl. LNG) |
≈ $1.0–1.4 trillion (region-priced)
|
~4,000 bcm |
New all-time highs in 2024; growth slows in 2025 but LNG capacity rising. |
| Copper |
≈ $220–235 billion |
~26 Mt refined usage |
Usage +5–6% YTD (Jan–Jul 2025); prices firm on tight supply. |
| Silver |
≈ $25–30 billion |
~31–33 kt (≈1,000+ Moz) |
Industrial demand (esp. solar) at/near record; 2025 prices higher YTD. |
| Soybeans |
≈ $220–230 billion |
~422 Mt (2024/25) |
Brazil exports strong; policy & weather drive spreads in 2025. |
| Wheat |
≈ $220–240 billion |
~787–792 Mt |
Weather & export policies keep risk premia elevated in 2025. |
| Corn (maize) |
≈ $280–300 billion |
~1,215 Mt (2024/25) |
Output high; stocks & ethanol policy key watch-items for 2025. |
| Aluminium (primary) |
≈ $165–175 billion |
~73 Mt |
Jan–Aug 2025 production +1.3% YoY; energy/carbon costs steer supply. |
| Coffee (green) |
≈ $50–60 billion |
~174–177 M bags (≈10.5 Mt) |
2025 prices firm; exports steady, stocks tight in key hubs. |
Note: Figures are rough estimates compiled from World Bank, commodity markets outlooks, industry press. “2024” is the latest full-year data; “2025 Trend Highlights” reflect early/mid-2025 observations and reports.
1. Crude Oil (WTI, Brent)
Crude oil is the most traded commodity worldwide, dominating global trade in volume and value. It is the primary fuel source for transportation, industrial production, and electricity generation, making it an essential resource for economic growth.
Two major benchmarks dictate crude oil pricing: Brent Crude, the global standard, and West Texas Intermediate (WTI), the U.S. benchmark. Economic activity, industrial production, and transportation needs drive the demand for crude oil, while OPEC production policies, geopolitical tensions, and technological advancements in extraction methods influence its supply.
saudi arabia, the United States, Russia, and Canada are the world's largest oil producers, while the biggest consumers are China, the U.S., and the European Union. Price fluctuations in crude oil have a ripple effect on economies worldwide, impacting inflation, manufacturing costs, and currency valuations.
2. Gold (XAU)
Gold is one of the oldest and most valuable commodities as a store of value, a hedge against inflation, and a safe-haven asset. It is extensively traded in physical form and through financial instruments such as futures contracts and exchange-traded funds (ETFs).
Investors turn to gold during economic uncertainty, inflation, and currency devaluation, making it one of the most actively traded commodities in the world. The demand for gold comes from central banks, jewellery manufacturers, and industrial applications, while its supply is determined by mining output and recycling activities.
Key factors influencing gold prices include interest rates, inflation, central bank policies, and geopolitical instability. Major gold producers include China, Australia, Russia, and the U.S., with London and New York as key trading hubs.
3. Natural Gas (NG or XNG)
Natural gas is one of the most traded commodities due to its vital energy source for electricity generation, industrial production, and residential heating. It is traded globally in two primary forms: pipeline gas and liquefied natural gas (LNG). The United States, Russia, and Qatar are among the largest producers, while Europe and Asia are major importers.
Natural gas prices fluctuate based on seasonal demand (higher in winter), production levels, geopolitical events, and alternative energy competition. With the global push toward cleaner energy sources, natural gas remains a crucial transition fuel.
4. Copper (HG)
Copper is a highly conductive metal essential for electrical wiring, construction, and manufacturing. Its demand is closely tied to global industrial growth, infrastructure development, and the transition to renewable energy (solar panels, wind turbines, and electric vehicles).
China, Chile, and peru are among the top producers, while economic indicators such as GDP growth, housing demand, and industrial production influence copper prices. It is often referred to as "Dr. Copper" because its price trends are described as a leading indicator of global economic health.
5. Silver (XAG)
Silver is both a precious metal and an industrial metal, making it unique among the most traded commodities. It is used in jewellery, electronics, medical equipment, and solar energy applications.
Investment demand, industrial production, inflation rates, and mining supply greatly influenced its price. Countries like Mexico, Peru, and China are the largest silver producers, while global financial markets actively trade silver through futures contracts and ETFs.
During economic uncertainty, silver often acts as a safe-haven asset, similar to gold, but with greater volatility due to its smaller market size.
6. Soybeans (S or ZS)
Soybeans may be a surprising inclusion in the most traded commodities, but they are a highly versatile agricultural commodity used for animal feed, vegetable oil, and plant-based protein products. The U.S., Brazil, and Argentina dominate soybean production, while China is the largest importer due to its vast livestock industry.
The prices fluctuate based on weather conditions, export demand, biofuel policies, and trade agreements between major producing and consuming countries. The rise of plant-based diets and increasing demand for soybean oil in biodiesel production continue to shape global soybean markets.
7. Wheat (W or ZW)
Wheat is a staple food crop and one of the most traded commodities due to its volume. It is essential for bread, pasta, and animal feed production, making it crucial to food security. Major wheat producers include Russia, the U.S., Canada, and Australia, while top consumers are China, India, and the European Union.
Weather conditions, government subsidies, export restrictions, and geopolitical factors heavily affect the price of wheat. Droughts, floods, or conflicts in major wheat-producing regions can lead to significant price volatility. Wheat futures are traded on the Chicago Board of Trade (CBOT).
8. Coffee (KC)
Coffee is one of the most consumed beverages worldwide, making it one of the most actively traded agricultural commodities. According to a study last year, coffee surged to a 47-year high and is currently up 72% year-to-date. The two main types of coffee traded are Arabica and Robusta, each with distinct flavour profiles and market demand.
The global coffee trade is dominated by countries such as Brazil, Vietnam, Colombia, and Ethiopia, which account for the majority of production. The United States and Europe are the largest coffee consumers, driving demand for high-quality beans.
Coffee prices are highly volatile and influenced by weather conditions, crop diseases, labour costs, and geopolitical factors in producing countries. The growing trend of speciality coffee and sustainable farming practices has also impacted pricing dynamics.
9. Corn (C or ZC)
Corn is one of the largest-volume traded agricultural commodities due to its wide-ranging applications in food, animal feed, and ethanol production. The United States is the leading producer and exporter, followed by Brazil, Argentina, and China.
Corn prices are affected by weather conditions, planting and harvest cycles, biofuel policies, and global supply-demand imbalances. The growing demand for ethanol as an alternative fuel source has further strengthened corn's role in the commodities market.
Supply disruptions, such as droughts in the U.S. Midwest, can lead to sharp price movements. Corn futures are heavily traded on the Chicago Mercantile Exchange (CME).
10. Aluminium (AH)
Lastly, on our list of the most traded commodities, aluminium is one of the most traded industrial metals due to its high demand and recyclability.
China dominates global aluminium production, with significant contributions from India, Russia, and Canada. The price of aluminium is influenced by energy costs, trade tariffs, industrial demand, and sustainability initiatives.
As industries shift toward electric vehicles and sustainable packaging, aluminium demand is expected to increase in the coming years.
2025 Commodities Trend for the Four Main Sectors
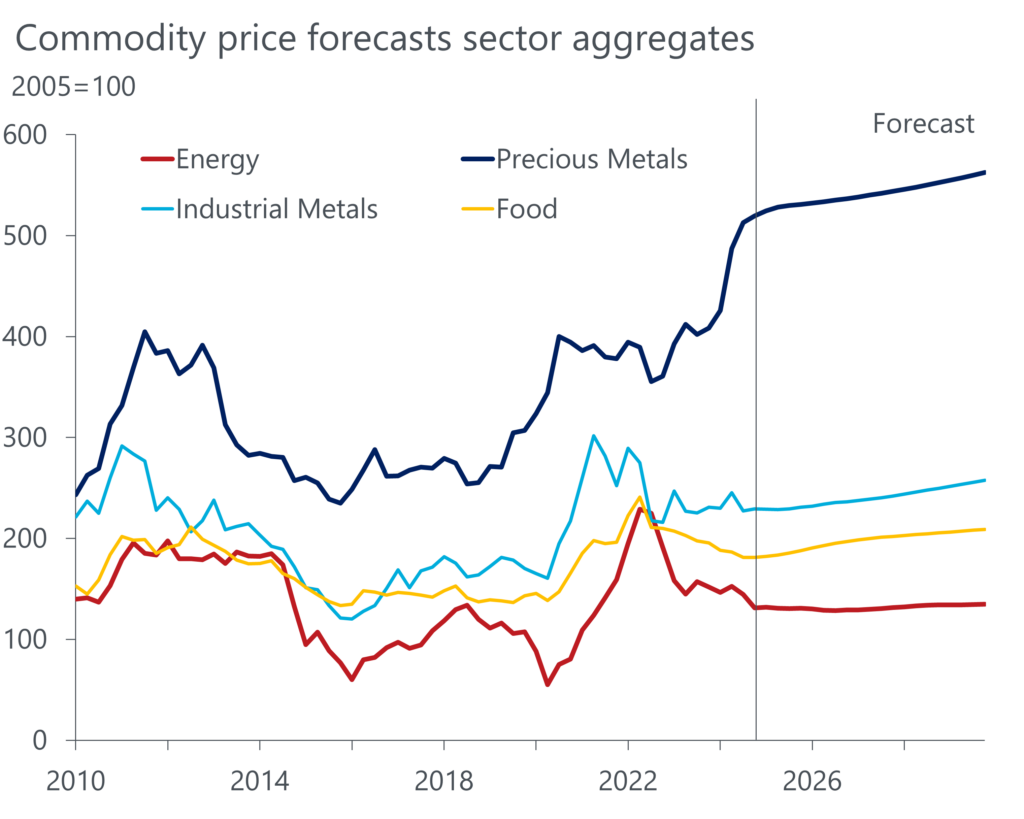
Unfortunately, commodity trading is historically uncertain and complex in 2025. One of the most critical aspects of commodity trading in 2025 will be the continued uncertainty in energy markets, particularly in natural gas and crude oil.
In addition, China's economy continues to be one of the largest influences on global commodity markets, but uncertainty surrounding its recovery is already causing ripple effects. The country's real estate struggles, shifting industrial policies, and strategic stockpiling decisions have made price forecasting for key commodities like copper, crude oil, and steel increasingly tenuous.
Moreover, Europe's economic recovery trajectory remains highly uncertain, and its ongoing energy security challenges will continue influencing commodity markets throughout 2025. The issue of Russian gas supplies remains unresolved, with Europe still searching for alternative energy sources to stabilise its industrial output.
Frequently Asked Questions
Which commodity is traded the most in 2025?
Crude oil remains the most traded commodity in 2025, driven by global energy demand and its influence on transport and manufacturing costs. Its deep liquidity and constant geopolitical relevance make oil the benchmark asset for both commercial hedging and speculative trading worldwide.
Why are gold and oil so influential in global markets?
Gold and oil shape inflation expectations, currency values, and investor sentiment. Oil fuels economic growth and production, while gold acts as a hedge against uncertainty. Together, they form the backbone of global trade and financial market stability.
How does commodity trading impact inflation and currencies?
When commodity prices rise, production costs increase, pushing inflation higher. Currencies of major exporters like the U.S. dollar, Canadian dollar, or Australian dollar often strengthen alongside their key commodities, linking market performance to trade flows.
What makes a commodity highly traded?
A commodity becomes highly traded when it offers high liquidity, strong global demand, and price volatility. These traits attract commercial users who hedge price risks and financial traders who profit from price movements, ensuring constant market activity.
Conclusion
As of October 2025, the “most traded” mantle is still defined by scale and liquidity, but the drivers have shifted. Energy is rebalancing as new supply meets softer demand growth, even as geopolitics keeps volatility alive; think oil demand rising modestly while surplus risk builds into 2026.
Safe-haven flows remain a defining theme: gold sits near record territory, underpinned by persistent central-bank buying and renewed ETF interest, proof that macro uncertainty still commands a premium. For diversified portfolios, precious metals continue to hedge policy and growth risks effectively.
Transition metals are the structural story. Copper’s balance may show a small surplus in 2025, but supply growth downgrades and electrification demand point to a deficit in 2026, supporting firm pricing into the medium term. Positioning around grid build-out, EV infrastructure, and data-center electrification remains a high-conviction theme.
Agriculture looks ample on paper, yet remains weather- and policy-sensitive. Production and trade have improved versus the early-2020s shocks, but stocks and flows can turn quickly on climate extremes and trade frictions, keeping hedging discipline essential.
Bottom line: commodities still set the pulse of global pricing and profits. The edge now comes from blending macro awareness with sector specifics, tracking policy shifts, supply disruptions, and cross-asset linkages, then acting with clear hedging rules and diversified exposures. That’s how you stay proactive, not reactive, in 2025’s markets.
Disclaimer: This material is for general information purposes only and is not intended as (and should not be considered to be) financial, investment or other advice on which reliance should be placed. No opinion given in the material constitutes a recommendation by EBC or the author that any particular investment, security, transaction or investment strategy is suitable for any specific person.


