Published on: 2025-07-21

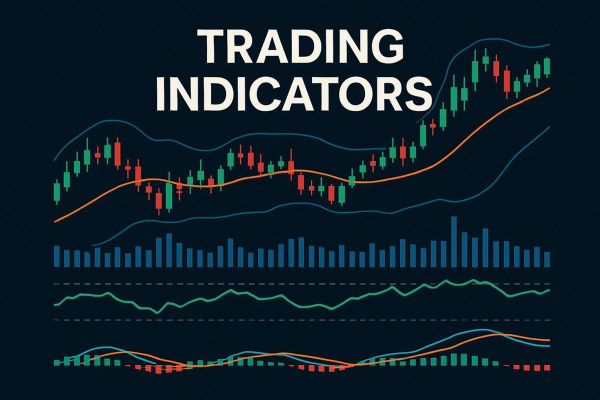
Technical analysis is one of the most widely used techniques in trading and investing to evaluate price swings and identify trading opportunities.
Whether you trade stocks, forex, or commodities, technical indicators can help you interpret complicated market behaviour into signals that are simple to understand and act upon.
This article will cover the top ten technical analysis indicators for beginners, their purposes, and how to use them effectively in any market.

1. Moving Averages (MA)
Overview
Firstly, moving averages smooth out price data over a specific period, helping traders spot trends and reversals.
There are two main types:
Simple Moving Average (SMA) – averages closing prices over a set number of periods.
Exponential Moving Average (EMA) – gives more weight to recent prices, making it more responsive.
How Beginners Can Use It
MAs help identify the overall direction of a trend. When the price is above a moving average, it's often seen as bullish; when it's below, bearish. The crossover of short-term and long-term MAs (e.g., 20 EMA crossing over 50 EMA) can signal trend reversals or entries.
2. Relative Strength Index (RSI)
Overview
RSI is a momentum oscillator that measures the speed and change of price movements on a scale from 0 to 100.
Readings above 70 indicate a market is overbought.
Readings below 30 indicate a market is oversold.
How Beginners Can Use It
RSI can help identify potential entry and exit points by showing whether an asset is overbought (due for a pullback) or oversold (due for a bounce). It works especially well in range-bound markets.
3. Moving Average Convergence Divergence (MACD)
Overview
MACD is a trend-following momentum indicator that shows the relationship between two EMAs (usually 12 and 26 periods).
It consists of:
MACD line
Signal line
A histogram showing the difference between the two
How Beginners Can Use It
MACD crossovers (MACD line crossing above signal line) are used to identify buy/sell signals. A rising histogram may indicate strengthening momentum.
MACD is a great introduction to momentum analysis because it combines trend and speed of movement in one tool.
4. Bollinger Bands
Overview
Bollinger Bands are volatility indicators that consist of a middle SMA line and two bands plotted two standard deviations above and below it.
How Beginners Can Use It
Price touching or breaking through the upper band may signal an overbought condition, while touching the lower band could indicate an oversold market.
In sideways markets, the bands contract, signalling potential upcoming breakouts. When they expand, it indicates increased volatility. Bollinger Bands are excellent for identifying shifts in volatility and distinguishing between consolidation and breakout zones.
5. Stochastic Oscillator

Overview
The stochastic oscillator compares a security's closing price to its price range over a set number of periods (typically 14). It helps indicate momentum direction.
Readings above 80 suggest overbought conditions.
Readings below 20 suggest oversold conditions.
How Beginners Can Use It
Use stochastic crossovers (where %K crosses above %D) to spot momentum shifts. It's effective in short-term trading strategies and range markets.
Stochastic indicators are easy to read and highly effective for beginners trying to spot reversals early.
6. Volume
Overview
Volume measures the number of shares or contracts traded in a given period. While not a technical indicator in itself, volume often serves as a confirming tool for price movements.
How Beginners Can Use It
High volume during a breakout indicates strength and conviction.
Low volume on rallies can signal a weak move or potential reversal.
Understanding volume reading provides insights into market strength, making it an essential tool for beginners.
7. Average True Range (ATR)
Overview
ATR calculates market volatility by averaging the range between high and low prices over a specific period. It does not indicate direction but rather how much an asset typically moves.
How Beginners Can Use It
ATR helps you:
Set proper stop-loss levels
Adjust position size based on risk
Understand when a market is unusually volatile
New traders often overlook risk management, and ATR offers a straightforward way to assess potential price fluctuations.
8. Fibonacci Retracement Levels
Overview
Fibonacci retracement is based on the idea that markets retrace a predictable portion of a move before continuing in the original direction. Common retracement levels include 38.2%, 50%, and 61.8%.
How Beginners Can Use It
Fibonacci retracements help spot:
Support and resistance zones
Entry points during pullbacks in an uptrend or a downtrend
It's especially powerful when combined with trendlines or moving averages.
9. Parabolic SAR (Stop and Reverse)

Overview
The Parabolic SAR plots dots above or below the price to indicate the current direction of the trend. When the dots flip sides, it signals a possible reversal.
How Beginners Can Use It
It is ideal for identifying exit points or trailing stops. In trending markets, the Parabolic SAR provides a simple visual to follow the movement and know when it is likely to end.
10. On-Balance Volume (OBV)
Overview
OBV uses volume flow to predict price changes. It adds volume on up days and subtracts volume on down days. If OBV is rising while price is flat, it may suggest accumulation and a possible upcoming breakout.
How Beginners Can Use It
Watch for OBV to confirm price movements or diverge from them—divergence may indicate a reversal. It's helpful for stock traders looking to analyse institutional activity or volume momentum.

While each indicator is powerful on its own, the real edge comes from using combinations that complement each other. Beginners should avoid using multiple indicators simultaneously, as this can lead to analysis paralysis.
Here's how to build a simple setup:
Use Moving Averages to identify trends
Add RSI or Stochastic for entry timing
Confirm moves with Volume or MACD
Overall, maintain simplicity. As you gain experience, you can try more advanced indicator strategies.
In conclusion, learning technical indicators is like learning a language. Each one tells you something unique about market behaviour—and when used correctly, these tools help traders make objective decisions instead of emotional ones.
Therefore, start with 2–3 indicators that make sense to you, test them on a demo account, and gradually build confidence.
Disclaimer: This material is for general information purposes only and is not intended as (and should not be considered to be) financial, investment or other advice on which reliance should be placed. No opinion given in the material constitutes a recommendation by EBC or the author that any particular investment, security, transaction or investment strategy is suitable for any specific person.