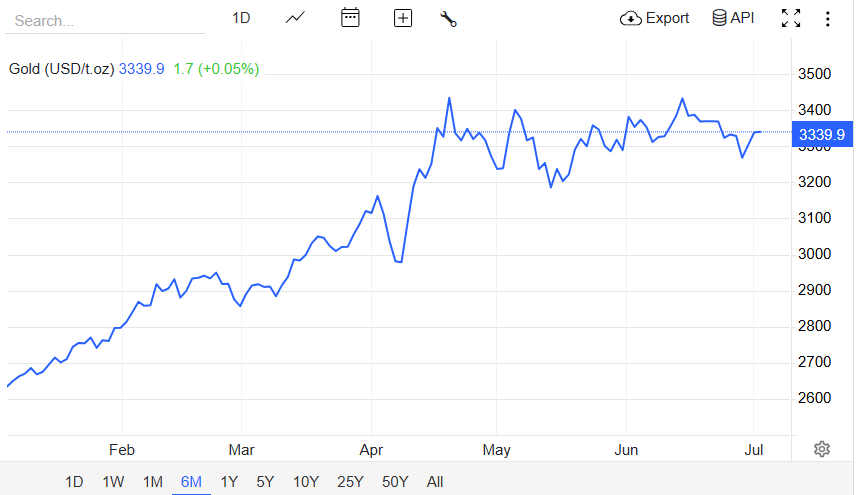
Gold (XAU/USD) continues trading in a tight range near $3,330, as investors weigh shifting interest rate expectations, geopolitical developments, and technical price action.
After hitting record highs above $3,500 in April earlier this year, the precious metal has entered a consolidation phase. Thus, traders and investors are now asking: Is this a pause before the next leg up, or a signal to take profits?
In this environment, discerning whether to hold, buy, or sell requires sharp attention to real-time charts, technical indicators, and macroeconomic forces—all of which we unpack below.
Real-Time Gold Chart Conditions: What the Price Action Reveals

1. Price Range, Support, and Resistance
After peaking near $3,500 in April, gold has been confined to a narrow range between $3,300 and $3,350. Intraday volatility has decreased, signifying consolidation.
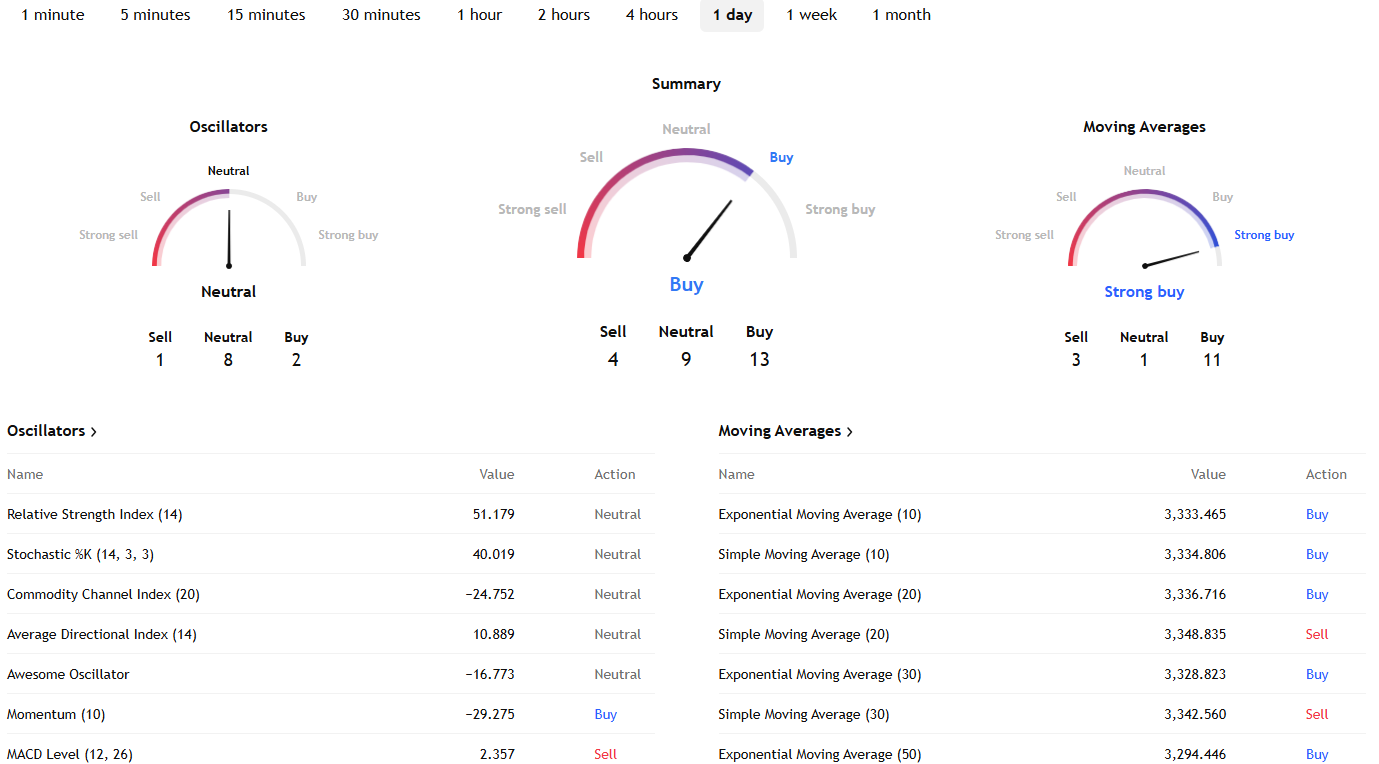
Chart models signal a short-term bullish trend: gold surged through signal lines and may retest support around $3,345 before aiming higher toward $3,525.
Conversely, other reports indicate a credible bearish breakout, with recent closes dipping below the 50‑day moving average near $3,295, suggesting potential downward pressure.
2. Technical Indicators

Elsewhere, RSI is near its lowest since February, a sign of weakening bullish momentum. Weekly charts confirm strong bearish momentum, with gold failing to sustain levels above the 50-day MA.
Overall, the technical setup shows consolidation with an increased risk of a pullback, unless decisive buying emerges.
Macro Drivers Influencing XAUUSD

1. U.S. Dollar and Interest Rate Outlook
Gold remains inversely correlated with the U.S. dollar. The dollar's recent weakness helped cushion gold, but the next moves will depend on the Fed rate path and labour-market signals. With uncertainty surrounding rate cut expectations, gold could struggle to increase further.
2. Geopolitical Risk and Central Bank Demand
Gold rallies in periods of uncertainty. Despite eased tensions in the Middle East and U.S.–China relations, central banks—especially in Asia—continue to boost gold reserves, which supports prices in the medium term.
3. Physical Demand and Market Structure
Jewellery and coin demand have shown signs of softness. Rising banknote prices have reduced consumer demand, which may restrict short-term gains even with optimistic projections for 2025–26.
XAUUSD Today Buy or Sell: Expert Views
| Scenario |
Price Range |
Strategy |
| Base |
$3,300–3,360 |
Buy dips, protect below $3,275 |
| Bullish |
$3,360+ → $3,525 |
Go long on breakout |
| Bearish |
$3,275 → $3,200+ |
Short/buy puts below key support |
HSBC's chief metals analyst warns that gold's current momentum is "toppy," and predicts a short-term pullback to $3,215–3,125—but the bank still sees support near $3,100–3,600 in 2025–26.
Other experts project further weakness into early 2026, targeting levels below $3,000 by late 2025 and early 2026, as economic improvement and risk-on appetite reduce safe-haven demand.
Conversely, analysts point out that should volatility increase or geopolitical conflicts escalate, gold might return to $4,000 by the end of this year or even in 2026
Overall, in the near term, anticipate low-to-moderate fluctuations until macro factors change, such as Federal Reserve indications or geopolitical tensions. In the medium term, opposing indicators—central bank acquisitions versus declining physical demand—might maintain gold within a range unless interest rates decrease or new disturbances arise.
Trading Implications: Real-Time Strategy Insights
Tactical Approach
Traders must adjust to gold's ongoing consolidation. As the 50-day MA has become resistance, purchasing dips around $3,300–$3,315 may provide low-risk opportunities. A safeguard stop beneath $3,275 corresponds with daily trends.
Breakout Play
A prolonged increase above $3,350–3,360 could signal a return towards $3,525 or higher. Elliott Wave analysis supports that a breakout may initiate another upward movement.
Downside Scenario
Not maintaining $3,295 may lead to further declines at $3,250, then $3,200–3,150. The pessimistic scenario proposed by experts suggests that these levels are realistic.
Conclusion
In conclusion, gold is presently in a holding phase. For traders, buying near support with tight stops offers an opportunity; breakout momentum could reaffirm option buying. Real-time charts show fading bullish momentum, and the metal's inability to break above $3,360 could lead to downside pressure.
Whether you're a swing trader monitoring for a breakout or a long-term investor seeking a value entry, the optimal approach right now is to exercise patience, coordinating entries with critical levels and macro catalysts. Gold's story isn't over, but in the short term, it's more about timing than conviction.
Disclaimer: This material is for general information purposes only and is not intended as (and should not be considered to be) financial, investment or other advice on which reliance should be placed. No opinion given in the material constitutes a recommendation by EBC or the author that any particular investment, security, transaction or investment strategy is suitable for any specific person.


