The Marubozu candlestick is a powerful technical charting pattern revered by traders across all timeframes. Known for its clear expression of bullish or bearish momentum, this candlestick offers insights into market confidence and potential trend continuations or reversals.
In this comprehensive guide, we explore what Marubozu candles are, how to interpret them, and how traders can leverage this pattern across different markets and trading styles.
What Is a Marubozu Candlestick?
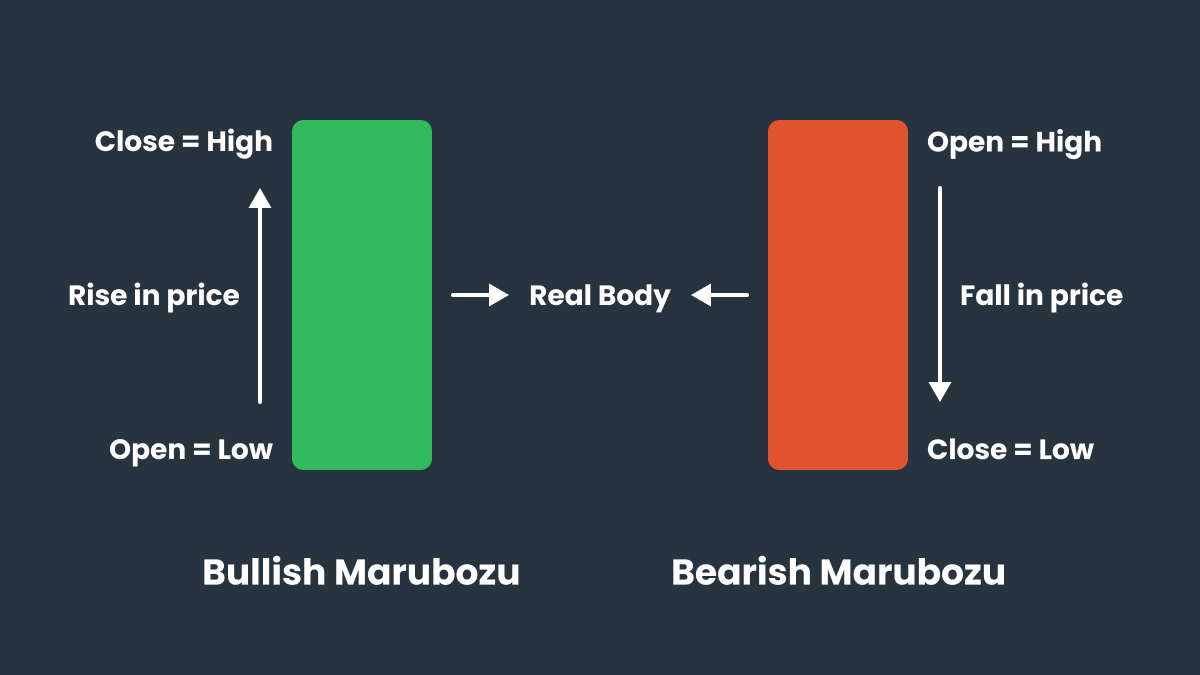
A Marubozu candlestick, derived from Japanese candlestick charting techniques, features a candle body with no or very short wicks/shadows. A bullish Marubozu opens at the low and closes at the high of the period.
Conversely, a bearish Marubozu opens at the high and closes at the low. These candles suggest that the price moved decisively in one direction.
This expressiveness helps traders identify periods of overwhelming buying or selling pressure, and whether that pressure is gaining or losing momentum.
Marubozu Candle Anatomy
A classic bullish Marubozu has a large green or white real body with the open equal to the low and the close equal to the high. There are no shadows because buyers controlled the price throughout the session.
A bearish Marubozu reverses this: its red or black real body starts at the high and finishes at the low. The absence of shadows indicates that sellers were in control from start to finish.
Partial Marubozu variants—candles with small wicks—signal that pressure remains strong, but not absolute.
As a side note, Marubozu forms across equities, forex, commodities, and crypto. In forex, these patterns are clearer due to minimal gapping. In longer timeframes, such as daily or weekly, Marubozu suggests institutional participation, making them more reliable. Traders may find success using monthly Marubozu candles for strategic positioning.
Types of Marubozu Candles
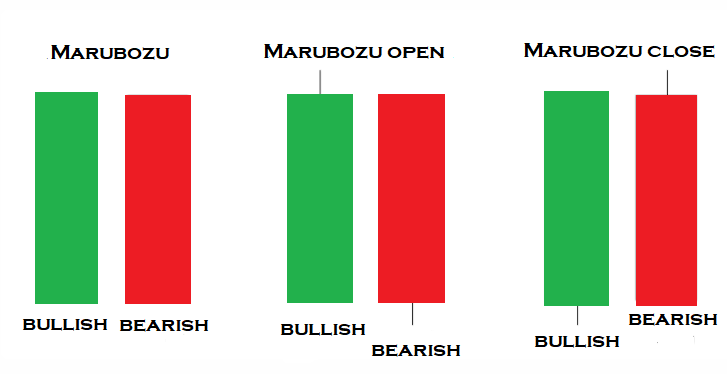
There are several Marubozu variations:
Full Marubozu with no shadows.
Opening Marubozu, featuring only an upper shadow on a bullish candle or only a lower shadow on a bearish one.
Closing Marubozu, with only a lower shadow on bullish and an upper shadow on bearish ones.
These variations indicate strength levels. A full Marubozu is the strongest, while opening or closing variants suggest pressure is present but may be slowing.
How to Identify Marubozu Candlesticks in Real-Time Charts
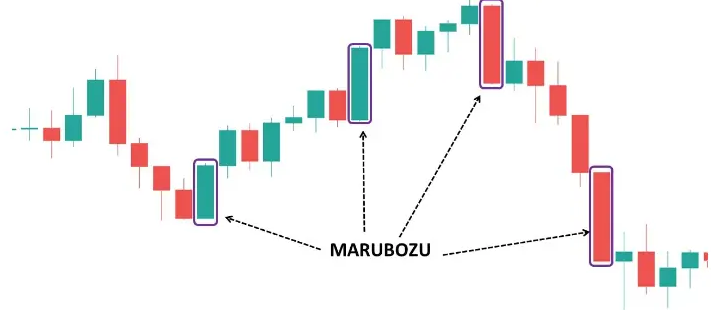
To identify a Marubozu, look for the following:
The candle must show directionality: bullish or bearish.
Shadows must be very small or completely absent.
The open and close match the extremes of the session.
The body should be significantly larger than the surrounding candles.
Validation comes from the candle's position: found at support/resistance, in trending or reversal scenarios.
Additional confirmation, such as volume spikes, momentum indicators, or price breakouts, can enhance setup reliability.
Trading Strategies
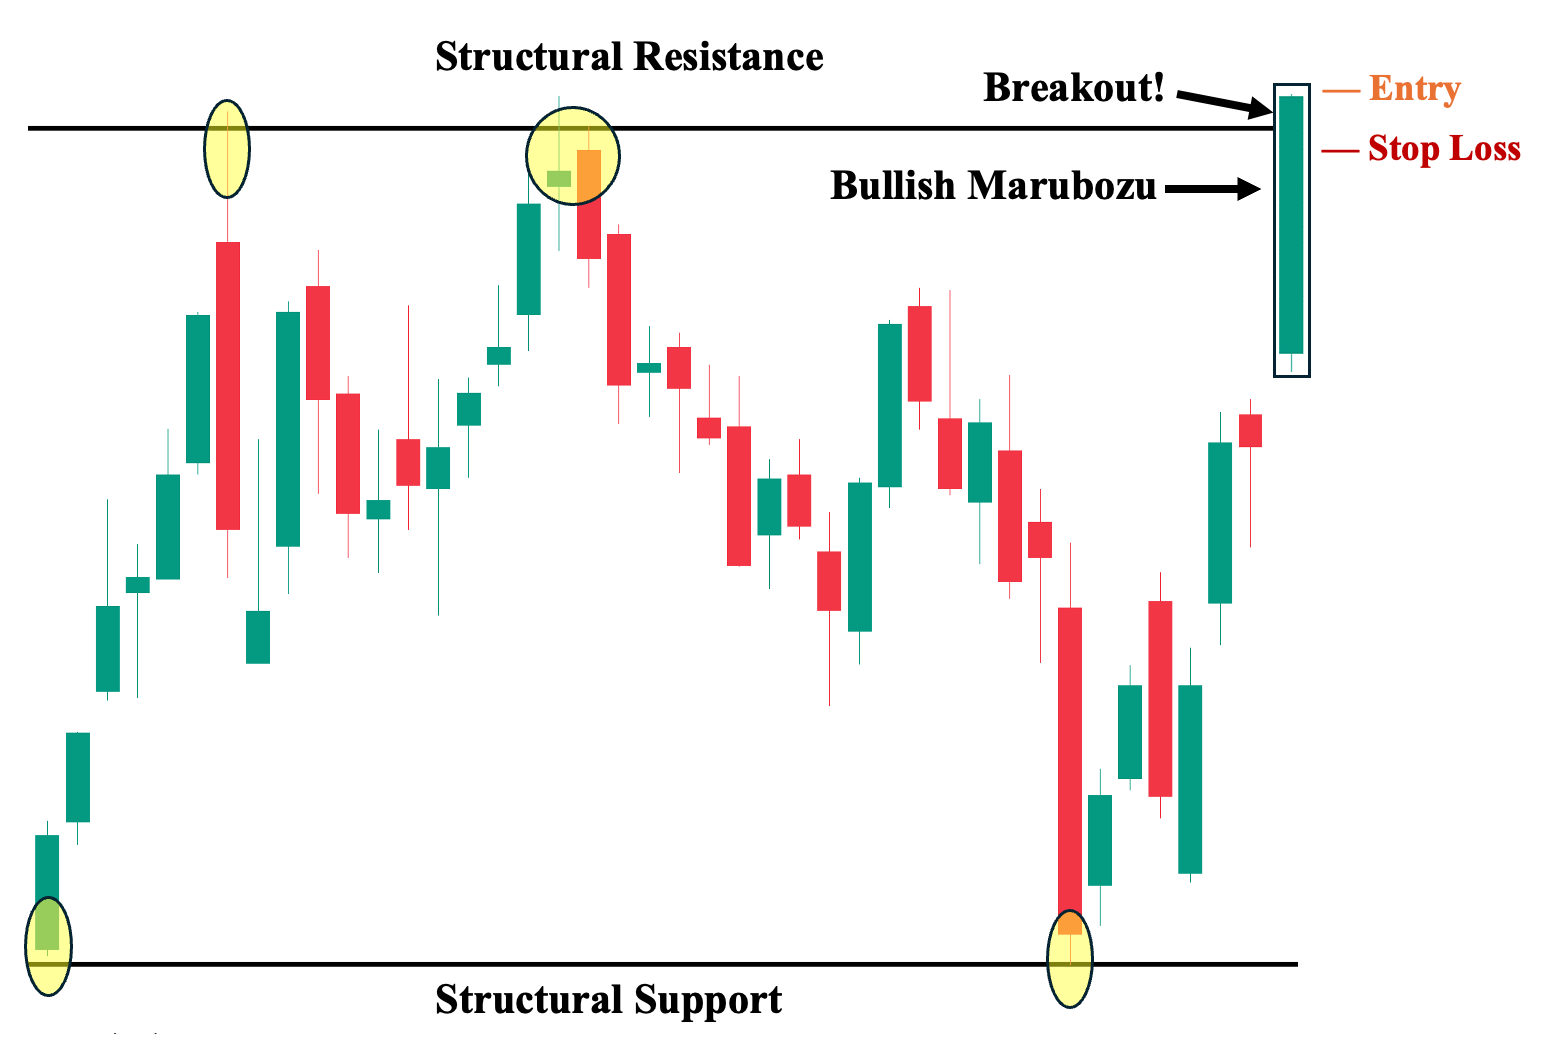
1. Breakout Trading
Traders often view a bullish Marubozu as confirmation of a breakout above resistance or consolidation. Buying near the closing level and placing protective stops below the candle can be effective. The counterpart applies to bearish trades.
2. Trend Confirmation and Continuation
Spotting a Marubozu aligned with the existing trend provides confidence to enter trending positions. Traders may layer in or hold positions as the pattern indicates dominance.
3. Reversal Signals
When a Marubozu occurs at key levels, it might signal trend exhaustion and a reversal. For example, a bearish Marubozu at a known top could trigger a reversal trade.
4. Volume-Based Entry
High volume accompanying the Marubozu adds confirmation. Traders can look for patterns with above-average volume for higher probability setups.
5. Multi-Timeframe Analysis
Using daily or weekly charts for robust signals and switching to intraday timeframes for entry can refine trade timing and enhance execution precision.
Limitations and Risks
Despite their appeal, Marubozu candles may generate false signals. Rapid reversals or news events can invalidate breakouts. In spread-driven or manipulated illiquid markets, Marubozu may mislead. It's vital to validate them with confluence, such as trends, indicators like RSI, or volume confirmation.
For more robust entries, pair Marubozu patterns with:
Volume spikes – adds conviction.
RSI or MACD – to gauge momentum alignment or divergence.
Support/resistance zones – for structural confluence.
Bollinger Bands or ATR – to measure volatility context and structure position sizing.
Tips for Beginners Using Marubozu
Start by identifying Marubozu patterns on higher timeframes to understand their impact. Track trades closely to learn the follow-through or failure tendencies.
Avoid overfitting or trading micro-timeframes (like 1-minute charts) where noise undermines pattern integrity. Keep a trade journal noting context, such as trend, volume, and pattern location.
Conclusion
In conclusion, the Marubozu candlestick is a straightforward yet powerful technical pattern that offers clarity in crowded charts. Whether confirming trends or signalling breakouts, an effective approach requires context, confirmation, and disciplined execution.
By combining Marubozu candles with volume, momentum indicators, and support/resistance, traders equip themselves with a reliable and intelligent filter for both intraday and swing strategies.
Disclaimer: This material is for general information purposes only and is not intended as (and should not be considered to be) financial, investment or other advice on which reliance should be placed. No opinion given in the material constitutes a recommendation by EBC or the author that any particular investment, security, transaction or investment strategy is suitable for any specific person.


