In technical analysis, moving averages remain one of the most reliable tools for identifying trends, gauging momentum, and timing trades. Among the many moving average systems available, the Guppy Multiple Moving Average (GMMA) stands out as a versatile and powerful indicator.
Developed by Australian trader Daryl Guppy, GMMA is designed to reveal trend strength and potential reversals with a multi-layered perspective.
If you're new to trading or looking to enhance your chart-reading skills, this guide will help you understand what GMMA is, how it works, and how to apply it effectively in your trading strategy.
What Is the Guppy Multiple Moving Average (GMMA)?

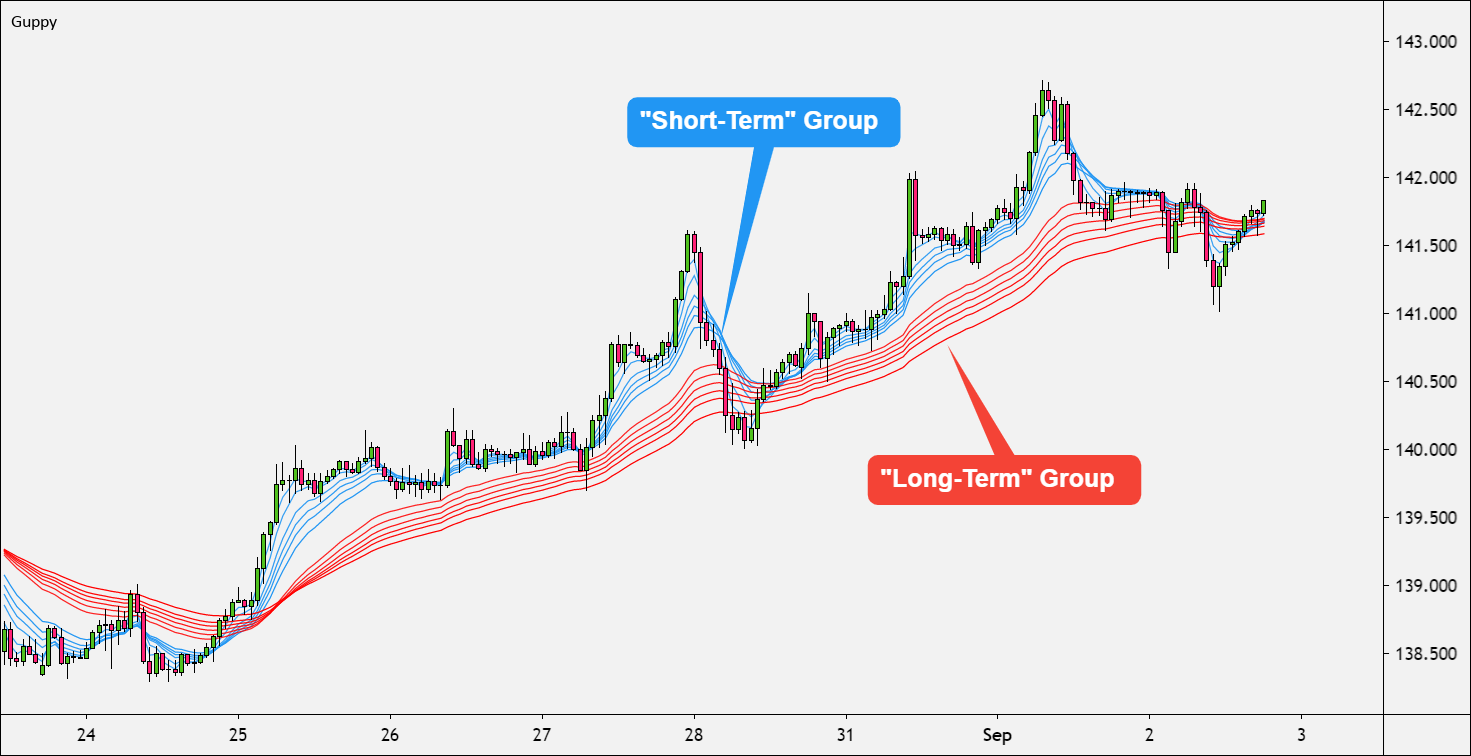
The Guppy Multiple Moving Average is a technical analysis tool that utilises multiple exponential moving averages (EMAs) grouped into two distinct categories: short-term and long-term. These two groups represent the behaviour of two types of traders:
By analysing the interaction between these two groups, traders can identify trend strength, trend reversals, and entry/exit opportunities with greater confidence.
GMMA Structure
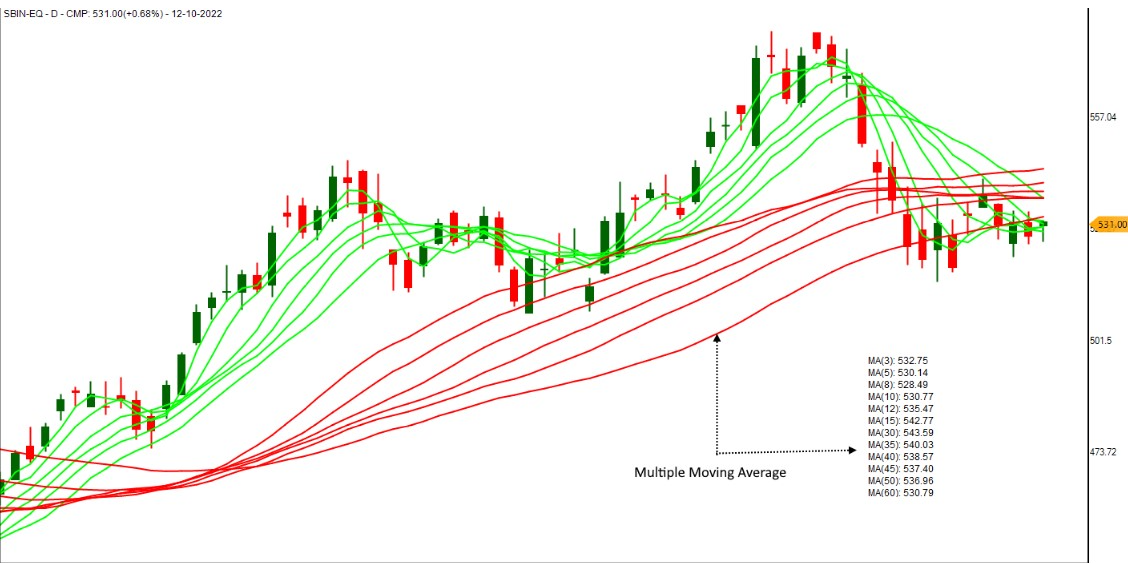
The GMMA consists of 12 EMAs plotted simultaneously on a price chart:
Short-term group (6 EMAs):
3, 5, 8, 10, 12, and 15 periods
Long-term group (6 EMAs):
30, 35, 40, 45, 50, and 60 periods
The short-term EMAs are more sensitive to recent price action, while the long-term EMAs respond more slowly and filter out noise.
This dual-layered view allows traders to observe how short-term momentum interacts with the broader trend.
Understanding How the Guppy Multiple Moving Average Works

The core principle of GMMA lies in the relationship between short-term and long-term EMA groups. Their spacing, convergence, and divergence provide valuable clues about market behaviour.
1. Narrow Banding Within a Group
When EMAs within either group are closely bunched together, it suggests agreement among traders in that group. For example:
2. Expansion Between Groups
When the short-term group diverges sharply away from the long-term group, it indicates strong momentum and a confirmed trend. The wider the separation, the stronger the trend.
3. Contraction Between Groups
When the short-term EMAs cross back toward the long-term group, or the gap narrows, it signals loss of momentum, potential reversal, or consolidation.
GMMA vs Traditional Moving Averages
Unlike using a single moving average or a pair (as in a typical crossover strategy), GMMA offers a more nuanced view. Traditional moving averages might tell you when a crossover happens, but they often lag in volatile or sideways markets.
GMMA, with its layered structure, helps filter out false signals and paints a clearer picture of trend health and crowd behaviour. It also acts as a visual heat map, showing whether traders and investors are aligned or in conflict.
How to Use GMMA in Your Trading Strategy

1. Identifying Trend Direction
When both groups of EMAs are sloping upward and well-separated, it confirms a strong bullish trend. The reverse is true for a significant bearish trend, where both sets decline and separate.
Traders can use this information to stay on the right side of the market by avoiding trades against the prevailing trend.
2. Spotting Entry Points
After a trend is identified, GMMA can help locate pullbacks or breakout setups.
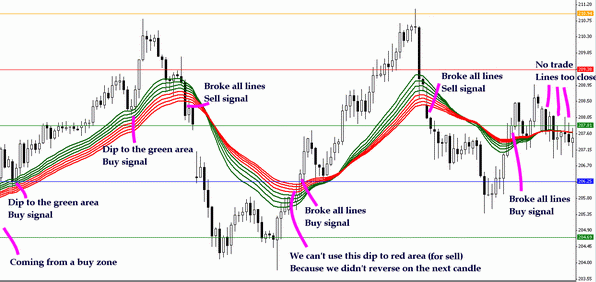
In an uptrend, wait for the short-term EMAs to compress or touch the long-term EMAs before bouncing upward again.
In a downtrend, look for the short-term group to rally toward the long-term group before turning down again.
These points often provide low-risk, high-reward entries within a larger trend.
3. Avoiding False Breakouts
GMMA helps filter out choppy or sideways markets, which are common traps for traders. If both groups are flat and interwoven, it's a sign of consolidation. It warns traders to stay out until a clearer direction emerges.
4. Trend Reversal Signals
A crossover of the short-term group over the long-term group, especially with expanding gaps, suggests a new trend may be forming. Look for confirmation with volume, price action, or other technical indicators.
Examples
Bullish Scenario
A stock initiates an upward trend, with long-term EMAs inclined upward and a significant gap between the two sets. A brief pullback causes the short-term EMAs to dip toward the long-term set.
Traders notice a rebound, validating ongoing strength and offering a perfect long entry.
Bearish Scenario
In a downtrend, the short-term EMAs stay below the long-term group, with both sets sloping downward. A temporary rally compresses the short-term group upward, but it fails to cross the long-term group.
The ongoing downward trend indicates a favourable chance to take a short position.
Advantages and Limitations
| Advantages |
Limitations |
| Clearly visualises short-term vs long-term trend behavior |
Lags behind real-time price action, especially in volatile markets |
| Filters out noise and reduces false signals compared to simple MA strategies |
Can appear cluttered due to 12 overlapping lines on the chart |
| Works effectively across various markets: Forex, stocks, indices, crypto |
Less effective in sideways or ranging market conditions |
| Helps identify pullbacks, breakouts, and reversals with higher confidence |
Requires confirmation from other tools or price action for better reliability |
| Suitable for multiple trading styles and timeframes (scalping to investing) |
May be overwhelming for complete beginners without proper chart organisation |
| Combines momentum and trend-following principles in one indicator |
Not built for predicting price targets—needs to be used alongside other tools |
Who Should Use GMMA?
GMMA is suitable for:
Beginners: Looking for an easy visual guide to trend direction and structure
Swing Traders: Seeking to trade pullbacks and breakouts within a trend
Long-term Investors: Wanting confirmation of trend strength and entry points
Forex Traders: GMMA performs especially well in these volatile, trending markets
Regardless of your experience level, understanding the dynamics between short-term and long-term participants can sharpen your market edge.
Tips for Mastering GMMA
Start with one timeframe: Master GMMA on a 1-hour or 4-hour chart before moving to daily or intraday setups.
Backtest your setups: Utilise historical charts to determine where GMMA delivered precise signals or faltered.
Maintain Simplicity: Avoid cluttering your charts with excessive indicators. GMMA pairs well with just one or two confirmation tools.
Journal your trades: Log your GMMA-based trades and review them weekly to identify patterns and improve consistency.
Conclusion
In conclusion, for beginners seeking an organised method to recognise trends, find entry points, and handle trades, GMMA serves as a great foundation.
The Guppy Multiple Moving Average is more than just another moving average crossover system. It offers a layered, nuanced view of market behaviour that allows traders to visualise the ongoing battle between short-term speculators and long-term investors.
Disclaimer: This material is for general information purposes only and is not intended as (and should not be considered to be) financial, investment or other advice on which reliance should be placed. No opinion given in the material constitutes a recommendation by EBC or the author that any particular investment, security, transaction or investment strategy is suitable for any specific person.


